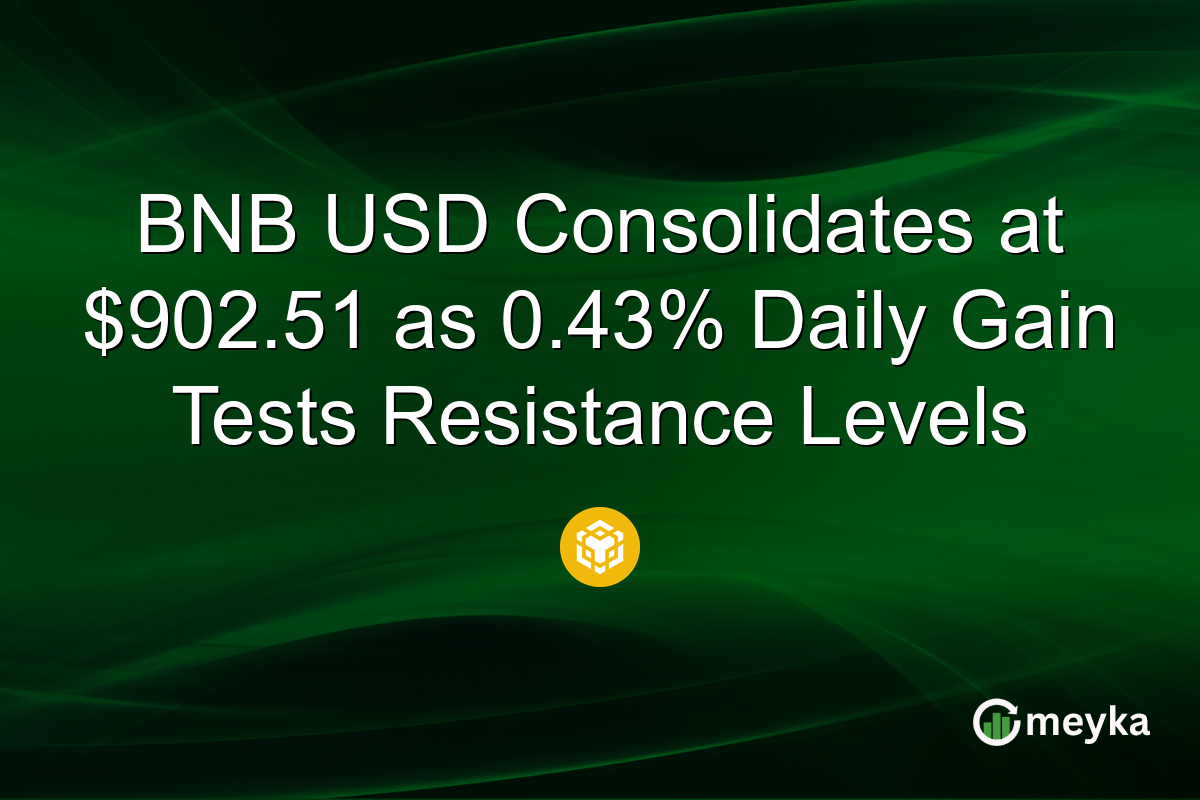
BNB USD Consolidates at $902.51 as 0.43% Daily Gain Tests Resistance Levels
BNB USD is trading at $902.51 as of January 29, 2026, with a modest 0.43% daily gain keeping the token near key resistance levels. The cryptocurrency has recovered 4.97 points from its previous close of $897.54, reflecting steady buying interest in the broader market. With a market cap of $124.3 billion and trading volume at 1.9 billion, BNB USD continues to show resilience despite recent volatility. Technical indicators reveal a balanced market structure, with the token consolidating between support and resistance zones. Understanding the current price action and technical setup is essential for tracking BNB USD price movements.
BNB USD Technical Analysis
The technical picture for BNB USD shows a neutral RSI at 52.04, indicating neither overbought nor oversold conditions. The ADX reading of 29.65 confirms a strong trend is in place, suggesting directional momentum remains intact. Price action is currently positioned between the Bollinger Bands, with the upper band at $915.75 and lower band at $815.29, giving traders clear technical boundaries.
The MACD histogram shows 8.88 points, though the signal line at -9.87 remains negative, suggesting some caution in momentum. The Stochastic indicator at %K of 72.49 and %D of 80.62 signals overbought conditions in the short term, which could precede a pullback. Support levels are established at the 50-day moving average of $883.72 and the 200-day average at $918.57, providing key zones for traders to monitor.
BNB USD Price Forecast
Monthly Forecast: BNB USD is projected to reach $865.52 by the end of February 2026, representing a -4.1% decline from current levels as consolidation pressures persist. Quarterly Forecast: The token could trade toward $936.23 by March 31, 2026, a 3.7% increase if buying pressure accelerates into Q1. Yearly Forecast: By January 2027, BNB USD may test $809.32, a -10.3% move if broader market headwinds intensify throughout 2026.
Longer-term projections show recovery potential, with the three-year target at $1,001.92 and five-year target at $1,193.37. These forecasts assume continued adoption of the Binance ecosystem and stable regulatory conditions. Forecasts may change due to market conditions, regulations, or unexpected events.
Market Sentiment and Trading Activity
Trading volume for BNB USD stands at 1.9 billion, slightly below the 30-day average of 3.0 billion, indicating moderate participation levels. The relative volume ratio of 0.95 suggests current trading activity is tracking near normal ranges without extreme buying or selling pressure. The Money Flow Index at 62.98 points to moderate accumulation, with institutional and retail traders showing balanced interest.
Liquidation data reveals that recent price movements have not triggered significant forced closures, allowing the consolidation pattern to persist. The On-Balance Volume indicator at -29.9 billion suggests selling pressure has accumulated over time, though recent daily gains indicate buyers are stepping in at support levels. Market sentiment remains cautious but constructive, with traders waiting for clearer directional signals before committing larger positions.
BNB USD Price Performance and Volatility
Over the past year, BNB USD has delivered a 36.29% return, significantly outperforming many altcoins in the crypto market. The year-to-date performance shows a 4.38% gain, with the token recovering from a -18.33% three-month decline that tested investor confidence. The 52-week range spans from a low of $503.12 to a high of $1,376.64, demonstrating the extreme volatility characteristic of large-cap cryptocurrencies.
Average True Range at $32.25 indicates typical daily price swings of this magnitude, giving traders a sense of expected volatility. The token’s five-year performance of 2,021% return underscores the long-term wealth creation potential of the Binance ecosystem. Current volatility levels remain elevated but manageable, with the Keltner Channels providing dynamic support at $815.59 and resistance at $944.58.
Key Support and Resistance Levels for BNB USD
The primary support zone for BNB USD is established at the lower Bollinger Band of $815.29, which has historically attracted buyers during selloffs. The 50-day moving average at $883.72 provides intermediate support, with this level proving critical during recent consolidation phases. The 200-day moving average at $918.57 acts as dynamic resistance, capping upside moves when the token approaches this zone.
Resistance levels are clearly defined at the upper Bollinger Band of $915.75 and the Keltner Channel upper band at $944.58. Breaking above $936 would signal potential movement toward the $1,000 psychological level, which historically attracts significant selling interest. The year-high of $1,376.64 remains a longer-term target, though current momentum suggests consolidation before any sustained rally toward that level.
Final Thoughts
BNB USD is consolidating near $902.51 with balanced technical indicators and moderate trading volume as of January 29, 2026. The token’s 0.43% daily gain reflects steady buying interest, though the neutral RSI and overbought Stochastic readings suggest caution in the near term. Technical analysis shows strong trend strength with the ADX at 29.65, while support at $883.72 and resistance at $915.75 define the current trading range. Price forecasts indicate potential weakness to $865.52 monthly but recovery potential toward $936.23 quarterly if market conditions improve. The broader market sentiment remains constructive, with BNB USD’s year-to-date performance of 4.38% and one-year return of 36.29% demonstrating resilience. Traders should monitor the Bollinger Bands and moving averages for directional signals, as a break above $936 could trigger movement toward higher resistance levels. The consolidation pattern suggests patience is warranted until clearer technical confirmation emerges.
FAQs
As of January 29, 2026, BNB USD is trading at **$902.51** with a **0.43% daily gain**. The token has recovered **$4.97** from its previous close of **$897.54**, reflecting steady buying interest in the market.
The RSI at **52.04** indicates neutral conditions, while the ADX at **29.65** confirms a strong trend. The Stochastic at **72.49** signals short-term overbought conditions, suggesting potential pullback risk in the immediate term.
Monthly target: **$865.52** (-4.1%). Quarterly target: **$936.23** (+3.7%). Yearly target: **$809.32** (-10.3%). Three-year projection: **$1,001.92**. Forecasts depend on market conditions and regulatory developments.
Support levels: **$883.72** (50-day MA) and **$815.29** (lower Bollinger Band). Resistance: **$915.75** (upper Bollinger Band) and **$944.58** (Keltner Channel upper). Breaking **$936** could signal movement toward **$1,000**.
BNB USD has delivered **36.29% returns** over one year and **2,021% over five years**, reflecting strong ecosystem growth. Current consolidation near **$902.51** may present entry opportunities for long-term holders monitoring support levels.
Market cap stands at **$124.3 billion** with daily trading volume at **1.9 billion**. The relative volume ratio of **0.95** indicates moderate participation near historical averages.
Disclaimer:
Cryptocurrency markets are highly volatile. This content is for informational purposes only. The Forecast Prediction Model is provided for informational purposes only and should not be considered financial advice. Meyka AI PTY LTD provides market data and sentiment analysis, not financial advice. Always do your own research and consider consulting a licensed financial advisor before making investment decisions.