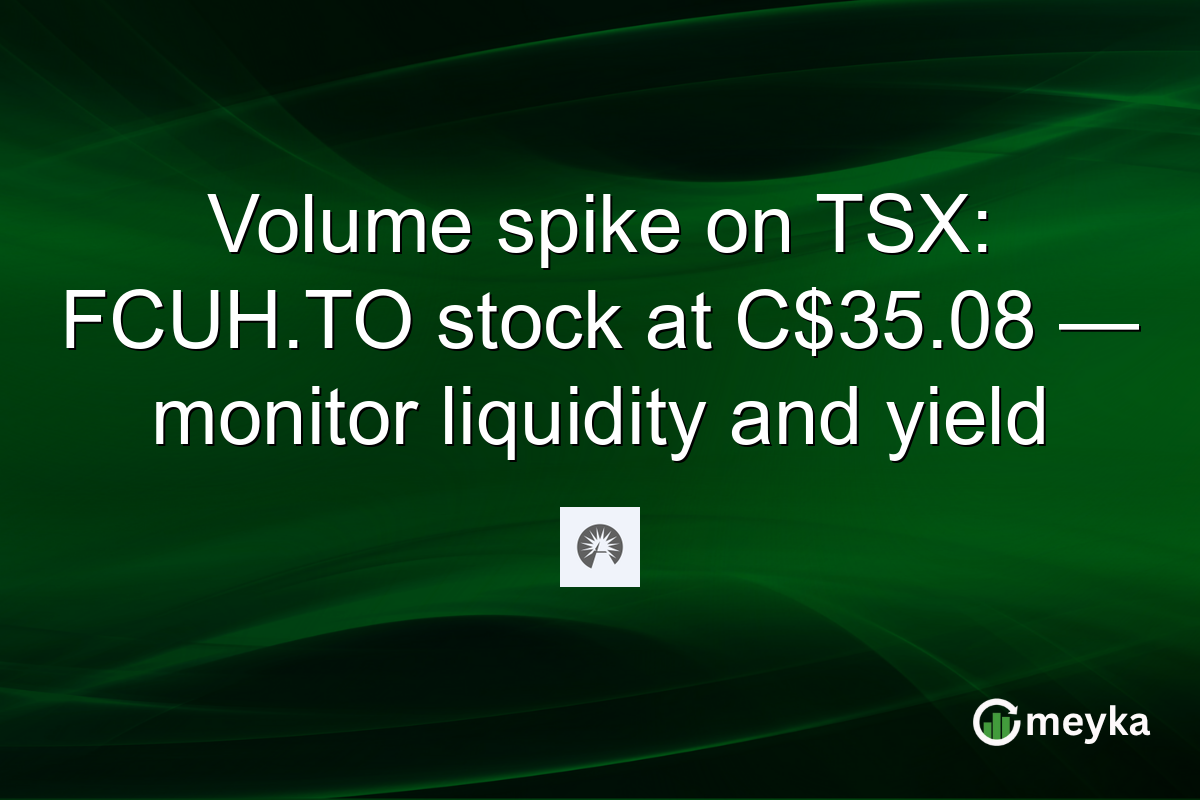
Volume spike on TSX: FCUH.TO stock at C$35.08 — monitor liquidity and yield
FCUH.TO stock registered a clear volume spike on TSX at market close on 28 Jan 2026, trading 22,000 shares against an average daily volume of 668. The ETF closed at C$35.08, up C$0.25 or 0.72%, and shows a relative volume of 32.93x, signalling outsized intraday attention. We review why the liquidity jump matters for traders, how dividend and valuation data stack up, and what Meyka AI’s short and medium forecasts imply for investors.
Continue Reading on Meyka
This article is available in full on our main platform. Get access to complete analysis, stock insights, and more.
Read Full Article →