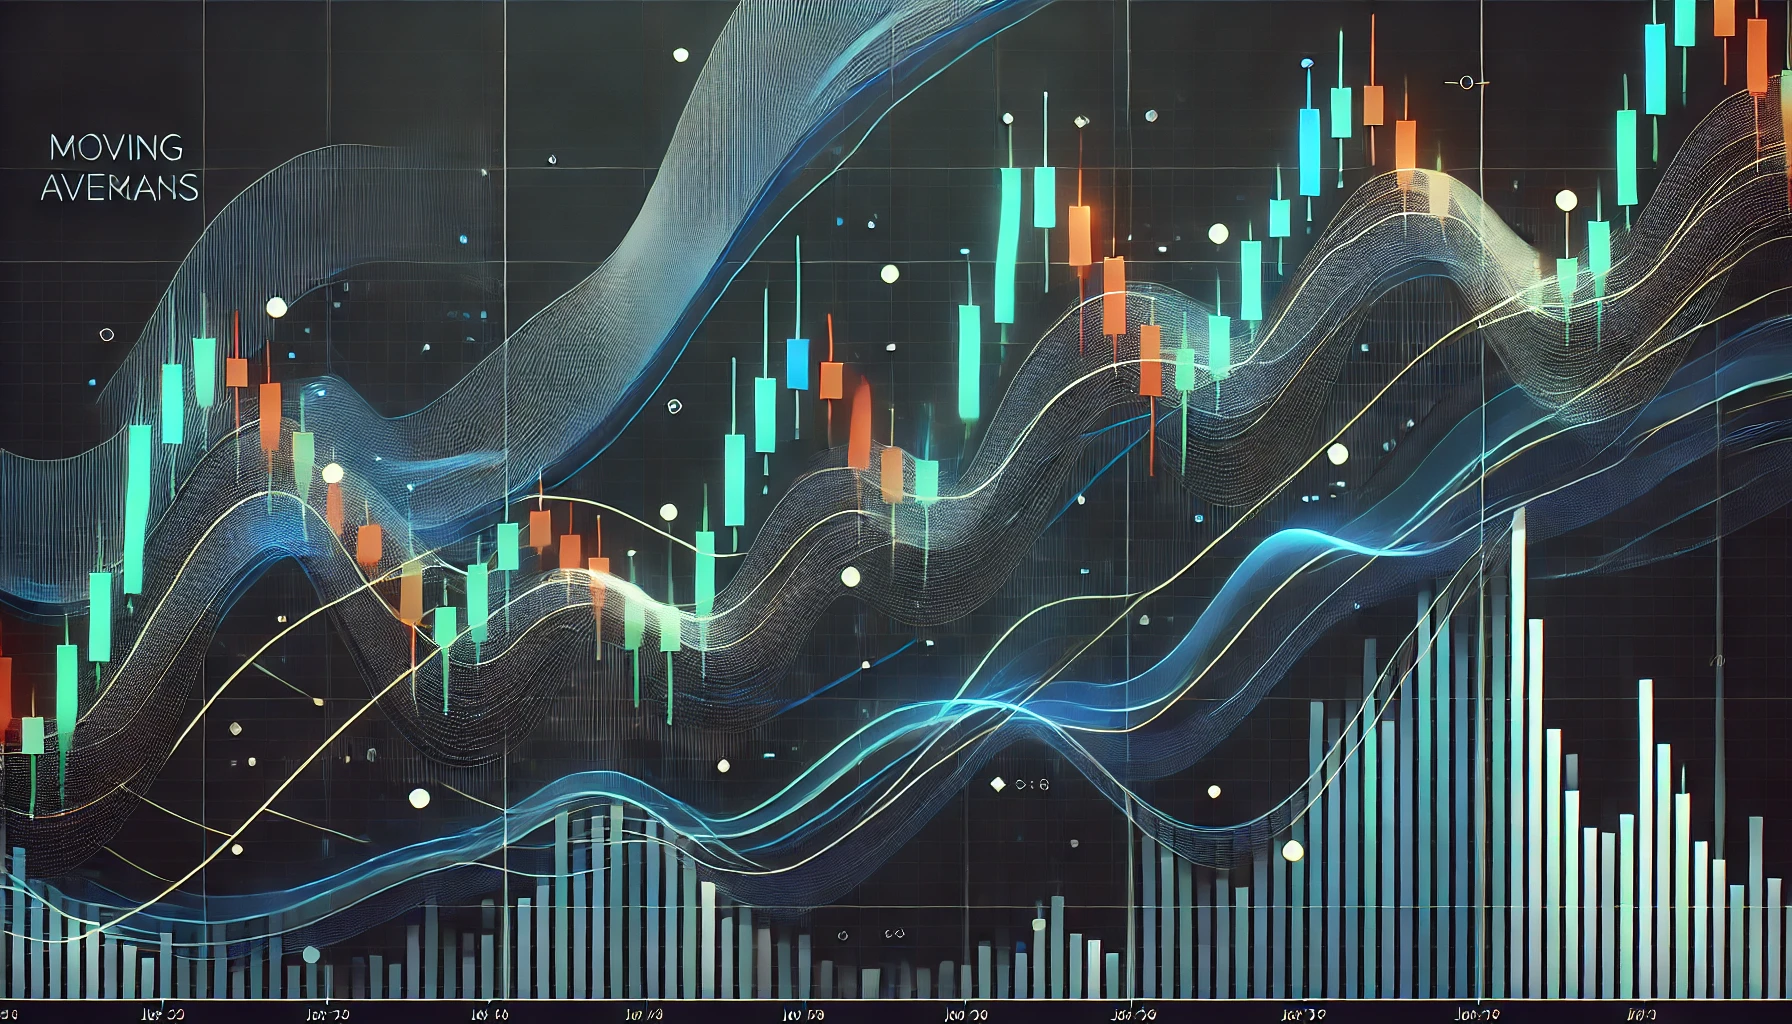
What are moving averages? How do they help in data analytics?
Moving averages help investors understand market trends by smoothing out price data. We’ll explore how this powerful tool transforms raw data into actionable insights for better trading decisions.
Continue Reading on Meyka
This article is available in full on our main platform. Get access to complete analysis, stock insights, and more.
Read Full Article →