Nifty 50 Chart Analysis: Will the Index Cross 25,500 and Extend the Bull Run?
The Nifty 50 has been on a strong upward journey in recent months, hitting multiple record highs and attracting heavy investor interest. As of October 13, 2025, the index is trading near the crucial 25,400 zone, raising one big question: can it break above 25,500 and continue the bull run? This level is not just a number. It represents market confidence, earnings strength, and global risk appetite.
Traders are closely watching price action, volume trends, and key indicators to understand the next move. At the same time, long-term investors are asking whether this rally is sustainable or losing steam. Global cues, corporate results, and sector rotation are also shaping momentum. Some analysts believe the uptrend still has fuel, while others warn of consolidation or profit booking.
Let’s explore the technical setup, sentiment, and scenarios that will determine Nifty’s next big move. Will the index break out to new highs, or is a pause on the way?
Recent Market Performance

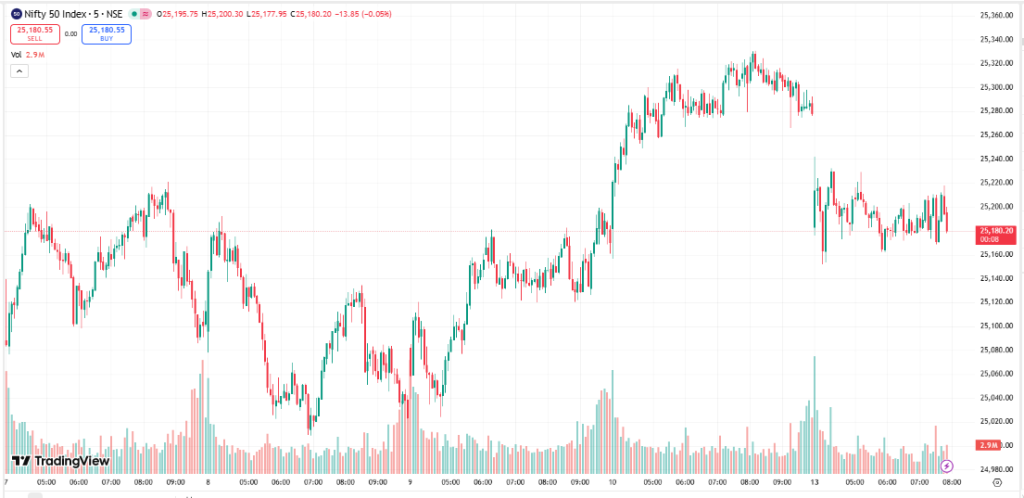
The Nifty 50 showed a mixed start to the week and slipped from recent highs on October 13, 2025. Markets reacted to renewed global tensions and a general risk-off mood. The index traded around the 25,200 zone after a small fall in the morning session. Domestic investors watched global cues closely as U.S.-China trade headlines weighed on sentiment. The intraday moves mirrored broader Asian weakness and a softer rupee.
Technical Chart Overview

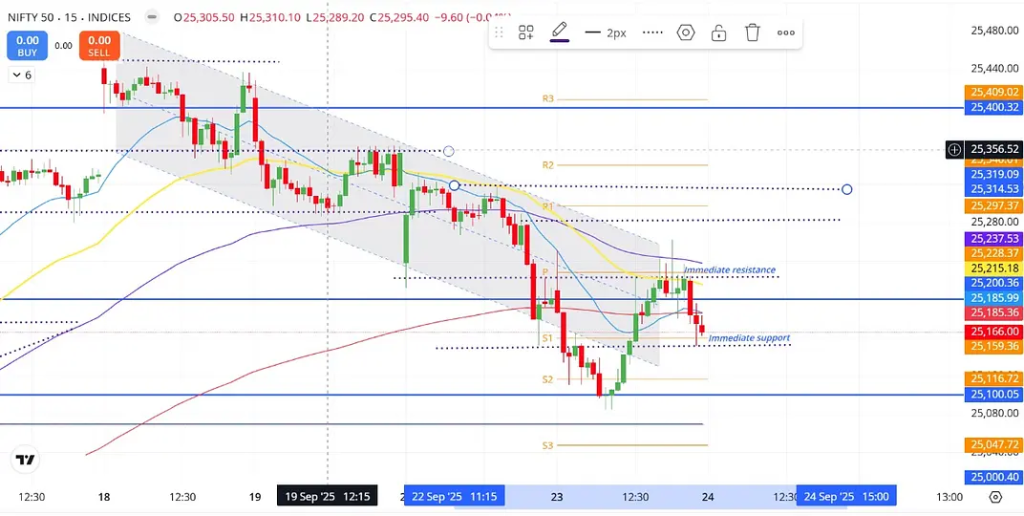
The Nifty’s short-term structure still reads as an uptrend. The index has posted higher highs over the past few weeks but shows signs of short-term fatigue. The most recent swing high sits near the 25,400-25,450 band. A rising trendline from prior lows acts as dynamic support. The 50-day moving average remains below the price and supports the bullish bias. A sustained close above 25,500 would confirm short-term strength. Failure to hold 25,000 could open room for a deeper pullback.
Key Technical Indicators

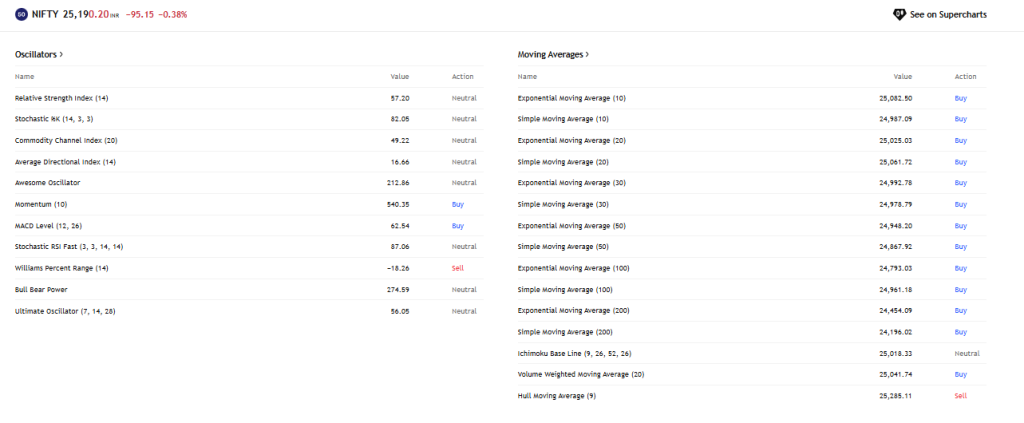
Relative Strength Index readings moved into the upper range, signaling that momentum is strong but close to overbought. MACD still shows positive spacing between the moving averages, but histogram bars have narrowed. Bollinger Bands have tightened a little, hinting at an upcoming expansion or correction. Volume on up-days has been credible, which supports the advance. However, any sharp drop with rising volumes would signal distribution and a change in bias.
Why 25,500 Is a Crucial Level?

The 25,500 mark sits at a cluster of technical and derivatives signals. It lines up with recent swing resistance and a set of option strikes with large open interest. Option chain data for mid-October shows sizable call open interest at the 25,500 strike. That setup creates a natural battleground where short covering or fresh buying could push the index higher, or option sellers could defend the level. Traders should watch how the price behaves when it approaches 25,500.
Bullish Arguments: Reasons Nifty Can Cross 25,500
Corporate India continues to report steady results. Strong GDP forecasts and a neutral policy stance by the RBI support the bullish case. Foreign inflows have shown signs of returning in recent sessions, which can add fuel to the rally. Domestic institutional investors remain active and often buy into strength. If global risk sentiment cools and liquidity stays ample, the market can extend gains toward 25,800 and beyond. The rising-growth narrative keeps investors willing to pay for quality names.
Bearish Arguments: Why Nifty May Face Rejection?
Global shocks can derail the move. On October 13, 2025, headlines about rising U.S.-China trade tensions hit markets and triggered a pullback. Rising geopolitical friction can reduce foreign flows and increase volatility. Valuations are stretched in several pockets. Any surprise in inflation data or renewed hawkish talk from major central banks could force a pause. A break below key supports would likely trigger swift profit booking among short-term traders.
Key Support Levels to Watch

Immediate support sits around 25,150 to 25,000. A weaker zone runs from 24,800 down to 24,500. Those supports are defined by prior lows and moving averages. Traders who hold long positions often place stops below these zones to limit downside. A decisive move below 24,500 would signal a change in market structure and could lead to a correction that tests deeper technical anchors.
Short-Term vs Long-Term View
Short-term traders should be prepared for choppy price action near resistance. Breakout traders may look for a sustained daily close above 25,500 with volume confirmation. Swing traders should manage risk at the noted supports and consider scaling into positions on clean pullbacks. Long-term investors face a broader macro story. The RBI’s stance and an upward GDP forecast give comfort. Yet, structural risks from global trade and capital flows remain. Long-term conviction should rest on fundamentals and valuation discipline.
Expert Opinions and Market Sentiment
Market strategists currently hold mixed views. Some see room for more upside given earnings upgrades and policy support. Others warn that the next leg higher will need clear leadership from cyclical sectors and stable foreign flows. Retail sentiment is leaning positive after recent gains, but political and macro headlines could quickly shift the mood. Monitoring institutional flow, FIIs, and DIIs remains vital for spotting regime changes. Recent weekly FII activity showed a return to net buying, signaling some renewed interest from foreign investors.
Scenarios: What Happens If…
If the Nifty breaks and holds above 25,500, the next technical targets sit around 25,800 and 26,000. Momentum players would add positions on follow-through. If the index fails at 25,500 and rolls over, expect a period of range-bound trade or a correction back to the key supports near 25,000 and 24,800. Option market dynamics around 25,500 will amplify moves in either direction, so watch open interest shifts closely.
Strategies for Traders and Investors
Short-term traders can trade the breakout or fade failure at 25,500 with tight stops. Position traders should use pullbacks to add to quality holdings and avoid chasing run-ups. Long-term investors should focus on fundamentals and use any sharp dips as buying windows for high-conviction names. Risk management matters. Keep position sizes reasonable and set stop-loss levels based on technical supports. Use tools like a dedicated AI stock research analysis tool to cross-check signals and stay disciplined.
Nifty 50: Upcoming Events to Watch
Important items to monitor include RBI commentary and any policy updates. Global central bank cues, especially from the U.S. can move flows and direction. Corporate quarterly results will shape stock-level leadership. Geopolitical news, such as trade policy developments between major economies, can alter sentiment rapidly. Traders should mark economic calendar releases, earnings dates, and any major policy statements for October and November 2025.
Wrap Up
The technical setup favors a fresh test of 25,500. The balance of forces depends on global headlines, foreign flows, and volume confirmation at key levels. A clean breakout above 25,500 on strong volume would open room for further gains. Conversely, a failed test could lead to consolidation or a deeper pullback toward major supports. Keep focus on risk control and watch the option market and institutional flows for early clues. The market can shift fast. Stay prepared and trade with clear rules.
Frequently Asked Questions (FAQs)
As of October 13, 2025, Nifty is close to 25,500. A breakout is possible if buying continues and global conditions stay stable without major negative news.
The bull run is still active, but momentum is slowing. Indicators show strength, yet traders are cautious due to global risks and profit booking at higher levels.
Current resistance is near 25,500. Important support levels are around 25,000 and 24,800. A break above resistance signals strength, while support protects against deeper falls.
Disclaimer: The above information is based on current market data, which is subject to change, and does not constitute financial advice. Always do your research.


