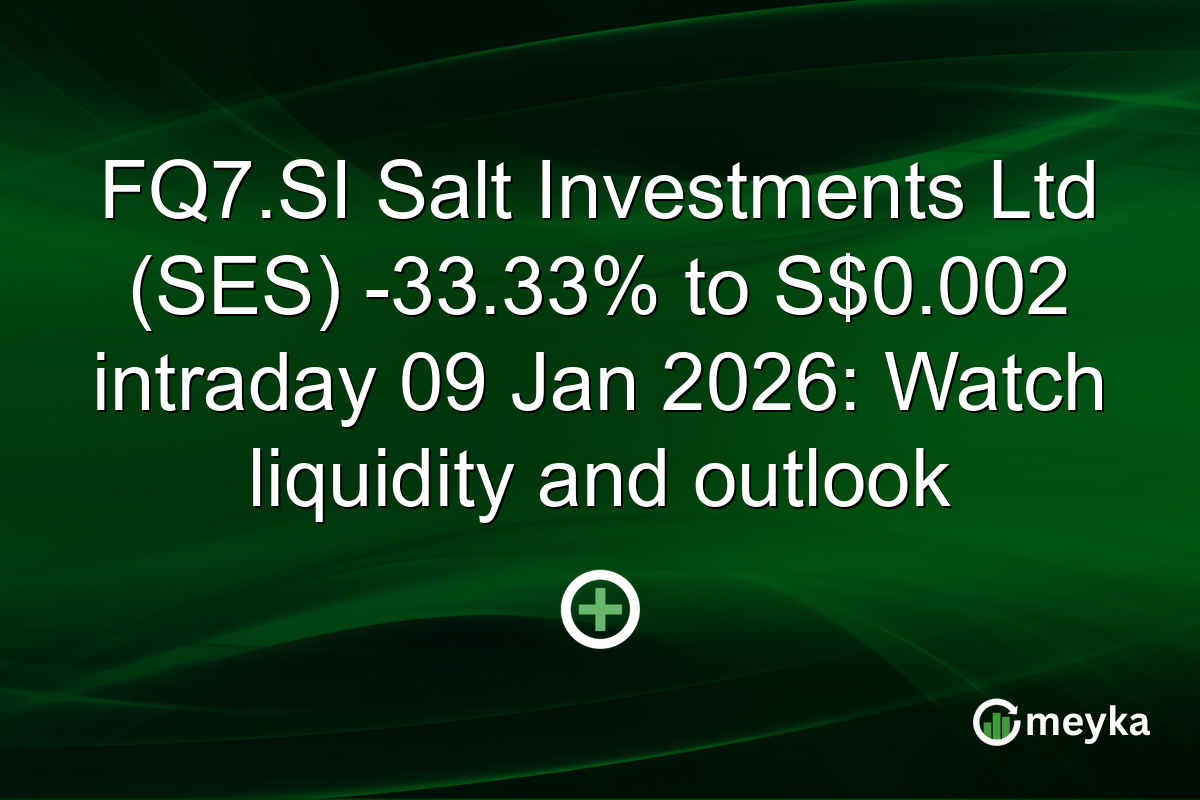
FQ7.SI Salt Investments Ltd (SES) -33.33% to S$0.002 intraday 09 Jan 2026: Watch liquidity and outlook
We open with the sharp intraday move in FQ7.SI stock: Salt Investments Limited slid -33.33% to S$0.002 on 09 Jan 2026. The drop followed heavy selling on low market cap and thin trading depth, with volume at 3,008,600.00 shares against a 50-day average of 9,448,298.00. We assess why the Salt Investments Limited (FQ7.SI) move matters today on the SES and what traders should watch next.
Intraday snapshot: FQ7.SI stock performance
FQ7.SI stock traded between a day low of S$0.002 and a day high of S$0.003 on 09 Jan 2026. The intraday change was -33.33%, with last print at S$0.002 and previous close S$0.003. Volume was 3,008,600.00 shares versus an average of 9,448,298.00, giving a relative volume of 1.59.
Market cap stands at S$48,593,533.00 and shares outstanding are 24,296,766,278.00, reflecting a very low per-share price and wide float.
Drivers of the decline: FQ7.SI stock news and fundamentals
Salt Investments Limited operates marine and ship repair services and is listed on the SES. The company changed its name from Jasper Investments Limited in November 2024. There is no recent EPS data and the next earnings announcement is listed for August 2025, which leaves the stock vulnerable to headline-driven swings.
Operational signals show stress: receivables turnover is 0.59 and days sales outstanding is 623.30 days, indicating slow collections. Working capital is S$8,208,000.00, but margins are negative with net profit margin at -48.26%, which helps explain selling pressure.
Valuation and balance-sheet snapshot for FQ7.SI stock
Key valuation metrics are mixed. Price to book ratio is 1.74, price to sales is 6.57, and enterprise value is S$43,306,533.00. Return on equity is -22.68%, and operating cash flow per share is -0.00021, highlighting weak cash conversion.
Debt levels are minimal with debt to equity at 0.00 (rounded), but the company posts negative free cash flow yield at -9.31%. The numbers suggest limited leverage risk but ongoing profitability and cash flow challenges.
Technicals and trading cues for FQ7.SI stock
Short-term technicals are neutral to weak. RSI sits at 57.26, ADX at 18.44 shows no clear trend, and the 50-day average price is S$0.00234 versus the 200-day average S$0.00290. Price sits below the 200-day average.
On-chain trading metrics show poor liquidity: on-balance volume is -70,906,800.00 and average volume remains low relative to institutional names. Traders should expect higher volatility on small order flows.
Meyka AI rates and analyst consensus for FQ7.SI stock
Meyka AI rates FQ7.SI with a score of 54.75 out of 100 (Grade C+, HOLD). This grade factors in S&P 500 benchmark comparison, sector performance, financial growth, key metrics, and analyst consensus. The score signals neutral conviction given thin liquidity and weak margins.
Analyst consensus data is limited. The lack of a formal price-target consensus increases event risk. We link to comparable market data for context Investing.com compare and peer comparisons Investing.com peers.
Risks and opportunities for FQ7.SI stock
Primary risks are persistent operating losses, slow receivables, and low liquidity which can magnify price moves. Negative margins and a long cash conversion cycle increase downside risk during market stress.
Opportunities include recoveries in shipping and marine repair demand. If management improves collections and margins, the short per-share price could offer upside, but that requires clear operational execution and volume improvement on the SES.
Final Thoughts
Today’s intraday sell-off in FQ7.SI stock reflects a mix of poor short-term liquidity and weak fundamentals. We note key metrics: market cap S$48,593,533.00, PB 1.74, and ROE -22.68%. Meyka AI’s forecast model projects a 12-month scenario price of S$0.004 versus the current S$0.002, implying an upside of 100.00%. Forecasts are model-based projections and not guarantees. Given the C+ (HOLD) Meyka grade and negative cash flow metrics, we view FQ7.SI as a speculative position for traders who can tolerate high volatility and low liquidity. For longer-term investors, improvements in receivables and operating margins would be required before upgrading exposure. For live quotes and order depth check the Meyka stock page for FQ7.SI and monitor sector flows on SES.
FAQs
Why did FQ7.SI stock fall by 33.33% today?
FQ7.SI stock fell due to thin liquidity, heavy intraday selling and weak fundamentals. Volume spiked to 3,008,600.00 on a small market cap, driving price to S$0.002 and magnifying the move.
What is Meyka AI’s grade for FQ7.SI stock?
Meyka AI rates FQ7.SI at 54.75/100 with Grade C+ and suggestion HOLD. The grade factors in benchmark and sector comparison, financial growth, metrics, and analyst signals.
Does Meyka AI forecast upside for FQ7.SI stock?
Meyka AI’s forecast model projects S$0.004 in 12 months versus current S$0.002, implying 100.00% upside. Forecasts are model-based projections and not guarantees.
What key risks should traders watch for FQ7.SI stock?
Watch slow receivables (days sales outstanding 623.30), negative margins, and low liquidity. These amplify price swings and increase execution risk on SES.
Disclaimer:
Stock markets involve risks. This content is for informational purposes only. Past performance does not guarantee future results. Meyka AI PTY LTD provides market analysis and data insights, not financial advice. Always conduct your own research and consider consulting a licensed financial advisor.