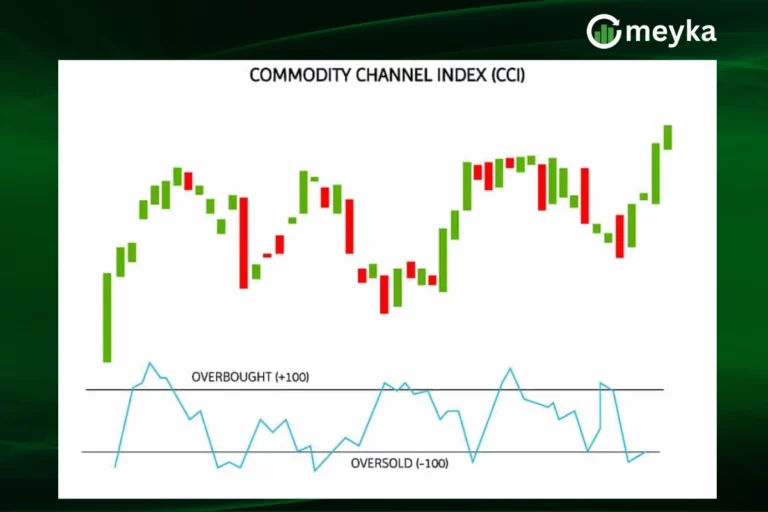
Fear-Greed Index: Gauging Investor Emotion in Stocks and Crypto

Fear-Greed Index: Gauging Investor Emotion in Stocks and Crypto

In financial markets, emotion often drives behavior just as much as logic. The Fear-Greed Index is a powerful tool that captures this emotional swing. Originally developed for the stock market, it now plays a growing role in cryptocurrency investing too.  By understanding how the index works, investors can make more informed decisions and avoid emotional…

Financial Ratios

Financial Ratios Explained: Essential Tools for Deeper Stock Analysis

Do you know that over 60% of investors use financial ratios before buying a stock? That’s because these numbers tell us more than just how much a company earns. They show how well it runs, how safe it is, and whether it’s worth our money. When we look at companies like Apple, we don’t just…

Commodity Channel Index (CCI): How to Find Overbought/Oversold Conditions

Commodity Channel Index (CCI): How to Find Overbought/Oversold Conditions

The Commodity Channel Index (CCI) is a versatile momentum oscillator, created in 1980 by Donald Lambert. While originally intended for commodities, it is now commonly used across equities, forex, and indices to identify potential turning points. The CCI helps traders spot overbought and oversold conditions, making it a valuable component in timing market entries and…

Producer Price Index

PPI Explained: What the Producer Price Index Is and How It’s Calculated

Did you know that before prices go up at the store, they often rise for the people who make or  sell the products first? The Producer Price Index, or PPI, keeps track of these early price changes. The PPI is a tool that tells us how much prices are changing for producers like factories, farms,…

EBITDA stands for Earnings Before Interest, Taxes, Depreciation, and Amortization. It’s not as scary as it sounds.

EBITDA: Meaning, Formula, History & Why It’s Questioned

Do you know some companies show profits even when they are losing money? That’s possible with a metric called EBITDA. EBITDA stands for Earnings Before Interest, Taxes, Depreciation, and Amortization. It’s not as scary as it sounds. In fact, it’s one of the most common ways investors and business owners look at profit. We use…

Economic indicators

What are economic indicators and how are these used for stock analysis?

Every day, the stock market moves up and down. But why does it happen? One reason is the economy. When the economy grows, stocks often rise. When it slows down, stocks can fall. We use economic indicators as a tool to understand these changes. These are facts and reports that tell us how the economy…

Ichimoku Cloud Indicator

Ichimoku Cloud Indicator: A Powerful Technical Analysis Tool

Do you know the Ichimoku Cloud was first created in Japan before computers even existed? A journalist named Goichi Hosoda designed it in the 1960s. He wanted a tool that could help traders see the full market picture, trend, momentum, and support or resistance, all at once. Today, we still use it because it works….

Social Security Benefits
|

Social Security Benefits in May: Find Your 2025 Payment Date

Do you know that over 71 million Americans receive Social Security benefits every month? For many of us, this money helps pay for food, rent, medicine, and other needs. That is why knowing the exact day we get paid is so important. In May 2025, the payment schedule will follow some special rules. Some of…