Volatility Indicators and VIX volatility indicator

What are Volatility Indicators and the Importance of Vix index in Volatility?

Picture the stock market as a heart monitor, with its lines zigzagging up and down. These movements, known as volatility, show the market’s pulse. We use tools called volatility indicators to understand this better. One key tool is the VIX Index, often called the “fear gauge.” It measures how much change investors expect in the…

What are the Best Indicators for Day Trading in 2025?

Day trading in 2025 is all about speed, precision, and the right tools. Having reliable indicators with fast market change can make all the difference. Indicators help you spot trends, time your trades, and avoid risky moves. But which indicators are the best for day trading this year? There are so many options. So, it’s…

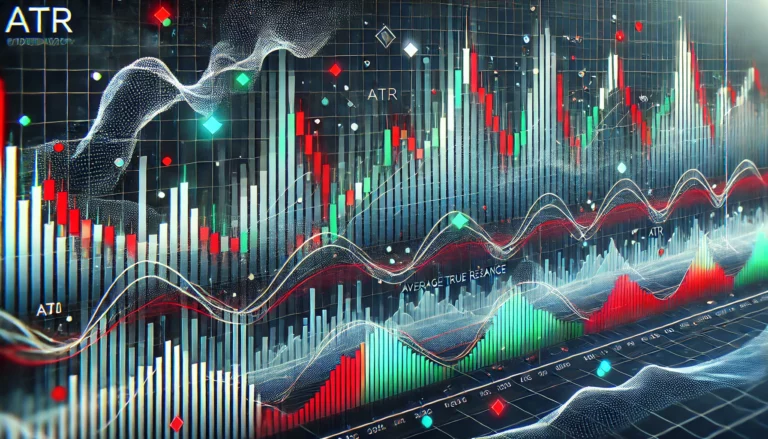
Technical chart showing ATR indicator measuring market volatility with price bars and bands

Decode Market Volatility: The Average True Range Indicator (ATR Indicator)

Average true range indicator (ATR indicator) helps us see market volatility clearly. Think of it as a tool that measures how much prices move up and down each day. What Makes ATR Special? Unlike basic price charts, the average true range indicator shows us the true movement in markets. It measures three key price moves:…
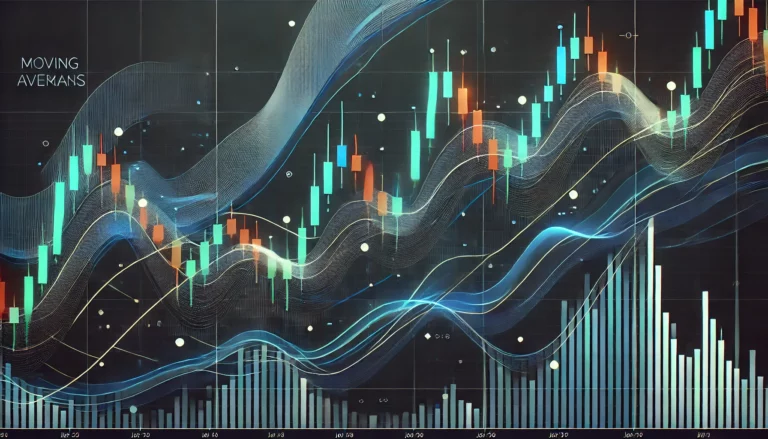
Technical analysis chart showing multiple moving average lines overlaid on stock price data with candlesticks

What are moving averages? How do they help in data analytics?

Moving averages help investors understand market trends by smoothing out price data. We’ll explore how this powerful tool transforms raw data into actionable insights for better trading decisions. Introduction A moving average helps filter market noise by calculating average prices over specific periods. This technique reveals underlying trends that might be hidden in daily price…

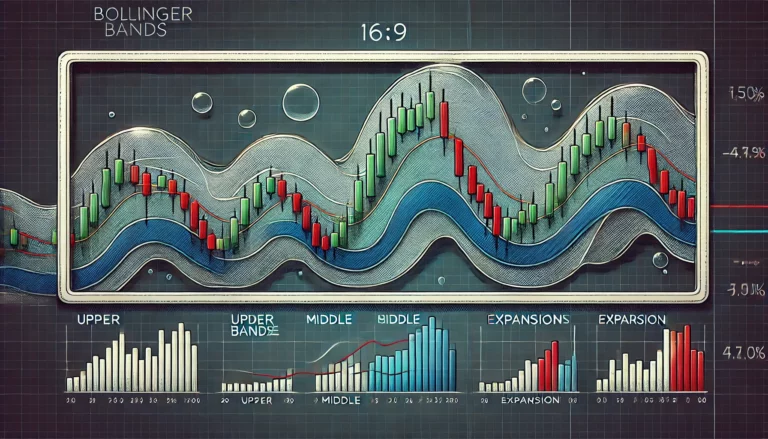
bollinger Bands and Meyka AI

What is Bollinger Bands, and how do they help in profitability from volatility?

Bollinger Bands help traders spot market trends and volatility. Created by John Bollinger in the 1980s, these bands show potential price ranges and market conditions. What Are Bollinger Bands? Popular technical analysis tool developed by John Bollinger in the 1980s. They consist of three lines: The distance between the upper and lower bands dynamically adjusts…

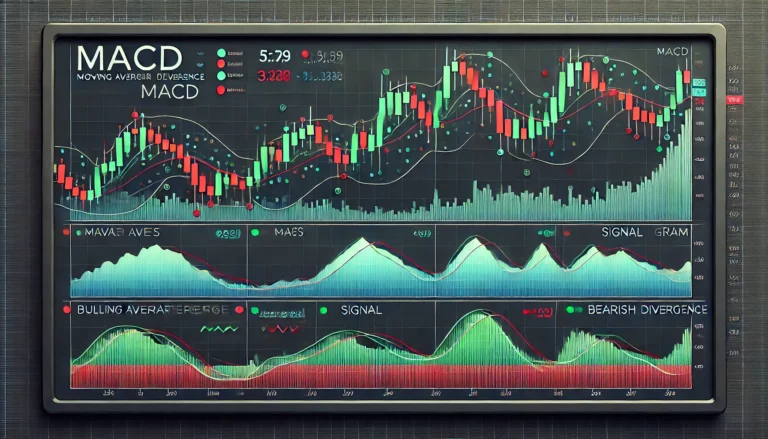
macd indicator

MACD Oscillator Indicator: Facts that every Investor should know

What is MACD? The Moving Average Convergence Divergence (MACD) helps traders spot trend changes and momentum. It shows the relationship between two moving averages of a price. MACD Formula MACD uses three key components: Understanding MACD Components MACD Line Shows momentum by comparing short- and long-term trends. Signal Line Acts as a trigger for buy…

Technical Indicators for AI Stock Prediction tools

7 Must have Technical indicators for Technical Analysis Tools

Investing isn’t just about luck, it’s about smart decisions through solid analysis. That’s where knowledge about the right tools for analysis becomes essential! If you’ve ever felt unsure about your next trading move, don’t worry, we’ve all been there. You can turn confusion into clarity with the right technical indicators. We will cover 7 must-have…

on-balance volume indicator

How to Use On-Balance Volume Indicator for Stock Trading Bots

Introduction to On-Balance Volume The on-balance volume (OBV) helps traders and trading bots spot market trends. It looks at how volume moves with price, showing how money flows in the market. OBV can help predict price changes before they happen. What is On-Balance Volume? On-balance volume is a momentum indicator that links volume to price…

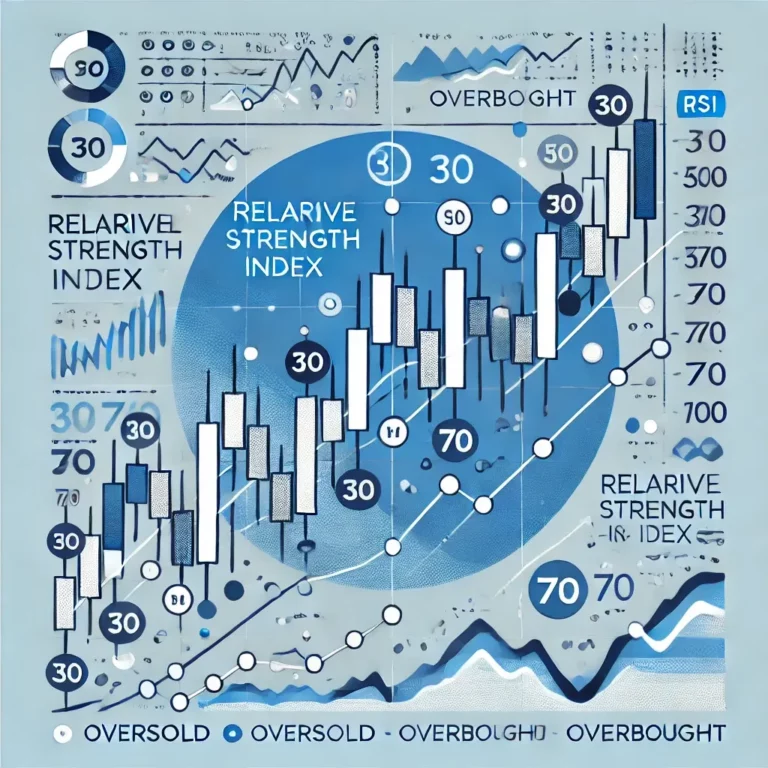
How to Calculate RSI: Complete Guide with Python Implementation

How to Calculate RSI: Complete Guide with Python Implementation

The Relative Strength Index (RSI) helps traders make smarter market decisions. This guide shows you how to calculate RSI using different methods. Whether you’re a Python programmer or an Excel user, you’ll find easy steps to follow. Understanding RSI (Relative Strength Index) RSI measures how fast and how much a stock’s price changes. Created by…