Commodity Channel Index (CCI) Explained: Strategy and Signals
The world of trading can be exciting, but it can also be confusing. Prices move fast, and it is hard to know when to buy or sell. This is where tools like the Commodity Channel Index, or CCI, are discussed. We can use CCI to understand market trends better. It helps us see when a stock, commodity, or currency might be overbought or oversold. Donald Lambert created CCI in 1980, and traders have been using it ever since to spot opportunities.
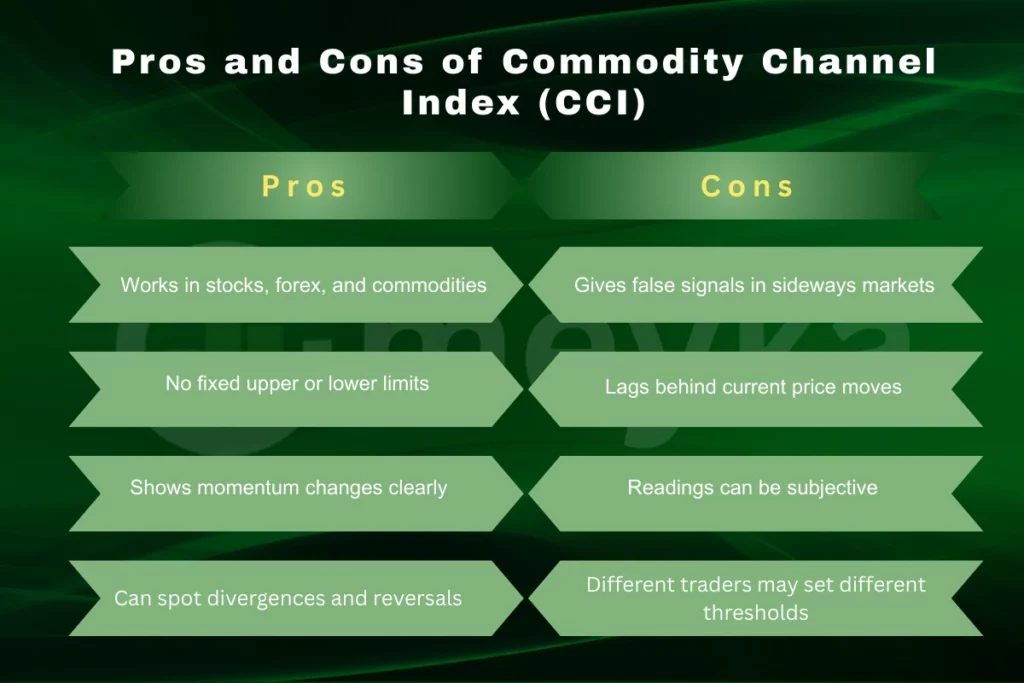
What makes CCI interesting is that it is not just for one type of market. We can use it in stocks, forex, or commodities. It gives signals about price movements and potential reversals.
Let’s break down how CCI works, how to read its signals, and how to use it in our trading strategies.
About the Commodity Channel Index (CCI)
The Commodity Channel Index (CCI) is a versatile technical analysis tool developed by Donald Lambert in 1980. Originally designed for commodities, it has since become widely used across various markets, including stocks, forex, and cryptocurrencies. The CCI measures the deviation of an asset’s price from its average price over a specified period, helping traders identify cyclical trends, overbought or oversold conditions, and potential trend reversals.
How CCI Works?
The CCI is an unbounded oscillator, meaning it doesn’t have a fixed upper or lower limit. This characteristic allows it to reflect varying levels of momentum across different markets. Typically, a CCI value above +100 indicates an overbought condition, while a value below -100 suggests an oversold condition. However, these thresholds can vary depending on the asset being analyzed. For instance, in highly volatile markets, CCI readings may exceed these levels without signaling an overbought or oversold condition.
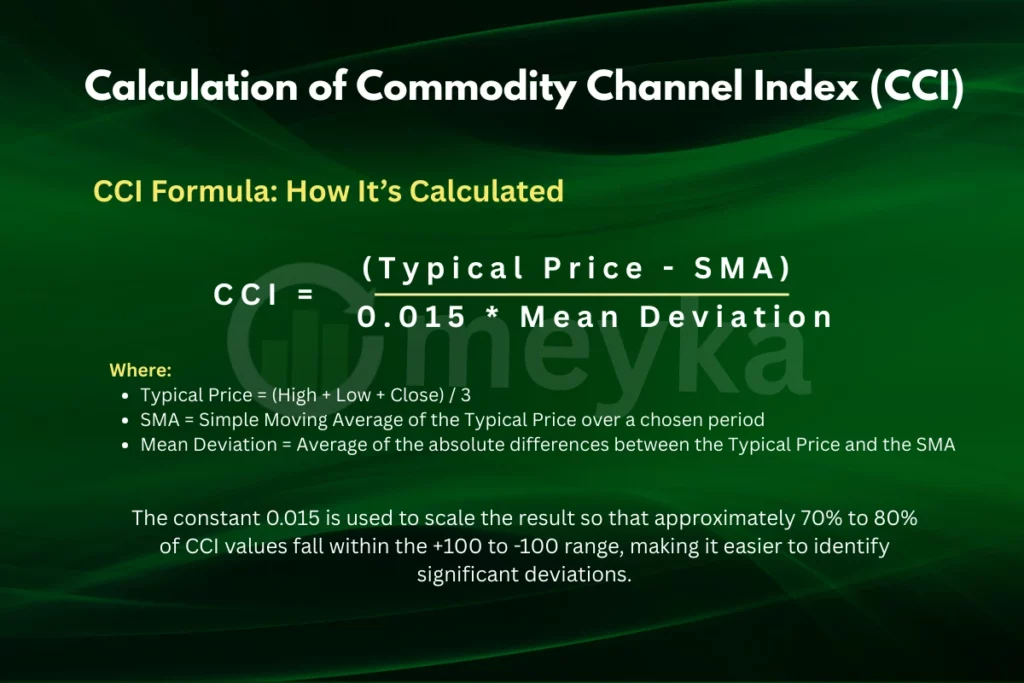
The CCI is calculated using the following formula:
CCI Trading Strategies
Trend-Following Strategy
In a trending market, the CCI can help identify the direction of the trend. When the CCI crosses above +100, it may indicate the beginning of an uptrend. Conversely, when it crosses below -100, it may signal the start of a downtrend. Traders can use these crossovers as entry points, entering long positions when the CCI moves above +100 and short positions when it moves below -100.
Overbought/Oversold Strategy
The CCI can also be used to identify overbought or oversold conditions. When the CCI rises above +100, it suggests that the asset may be overbought, and a price correction could be imminent. Similarly, when the CCI falls below -100, it indicates that the asset may be oversold, and a price rebound could occur. Traders can use these signals to enter trades in the opposite direction, selling when the CCI is above +100 and buying when it is below -100.
Divergence Strategy
Divergence occurs when the price of an asset forms new highs or lows that are not mirrored by the CCI. Bullish divergence happens when the price makes lower lows, but the CCI forms higher lows, suggesting weakening downward momentum and a potential reversal to the upside. Bearish divergence occurs when the price makes higher highs, but the CCI forms lower highs, indicating weakening upward momentum and a potential reversal to the downside. Traders can use these divergences as early indicators of potential trend reversals.
Combining with Other Indicators
While the CCI is a powerful tool, it is most effective when used in conjunction with other technical indicators. For example, combining the CCI with moving averages can help confirm the direction of the trend. If the CCI is above +100 and the price is above a moving average, it strengthens the case for an uptrend. Similarly, combining the CCI with volume indicators can provide additional confirmation of the strength of a trend.
Entry and Exit Signals Using CCI
Traders can use the CCI to time their entries and exits more effectively. For instance, entering a long position when the CCI crosses above +100 and exiting when it crosses below +100 can help capture trends. Similarly, entering a short position when the CCI crosses below -100 and exiting when it crosses above -100 can help profit from downward trends. It’s important to note that the CCI should be used in conjunction with other indicators and analysis techniques to confirm signals and reduce the risk of false positives.
Practical Tips for Using CCI
- The default setting for the CCI is typically 14 periods, but this can be adjusted based on the asset being analyzed and the trader’s strategy.
- Analyzing the CCI on multiple timeframes can provide a clearer picture of the market’s direction and strength.
- Using the CCI in conjunction with other technical indicators, such as moving averages and volume indicators, can help confirm signals and reduce the risk of false positives.
- Before implementing a CCI-based strategy, it’s essential to backtest it on historical data to assess its effectiveness and make necessary adjustments.
Bottom Line
Traders use the Commodity Channel Index (CCI) to spot trends, overbought or oversold conditions, and possible trend reversals. Understanding CCI allows traders to read market momentum more clearly. Combining CCI with other technical indicators strengthens analysis and guides smarter trading decisions. Successful traders integrate CCI into a complete trading strategy and follow strict risk management rules. This approach reduces mistakes and improves the chances of consistent profits.
Frequently Asked Questions (FAQs)
The CCI helps identify overbought or oversold conditions. A reading above +100 suggests overbought, while below -100 indicates oversold. Traders use these levels to time entries and exits.
CCI is useful for spotting trends and price extremes. However, it can produce false signals in sideways markets. It’s best used with other indicators for confirmation.
RSI is simpler and more reliable for most markets. CCI is more dynamic and can spot earlier signals. Both have strengths; combining them can enhance analysis.
The CCI measures how far a price deviates from its average. It helps identify overbought or oversold conditions, signaling potential trend reversals.
Disclaimer:
This is for informational purposes only and does not constitute financial advice. Always do your research.
