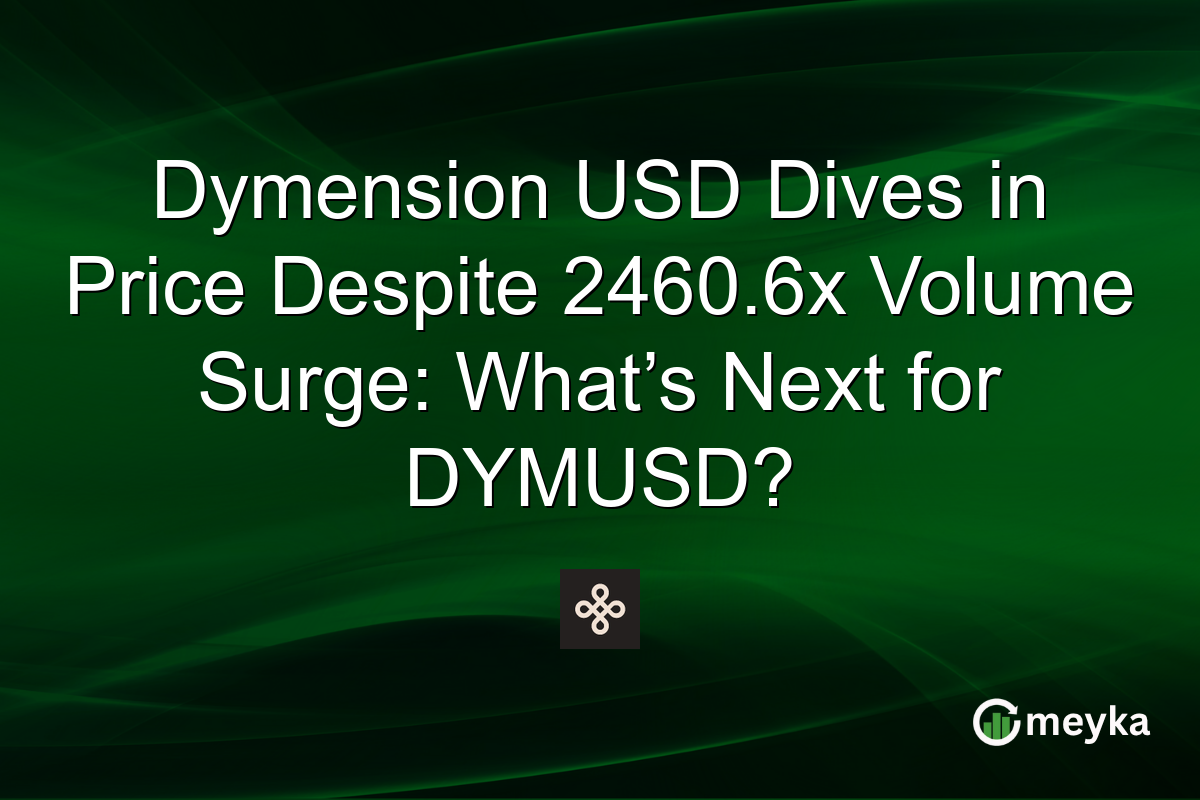
Dymension USD Dives in Price Despite 2460.6x Volume Surge: What’s Next for DYMUSD?
Dymension USD (DYMUSD) witnesses a massive volume spike of 2460.6 times its average, yet its price has tumbled to $0.0772, down by 9.39%. With recent news highlighting a mix of gains and losses, traders are curious about what these shifts mean for DYMUSD’s future.
Price Analysis and Targets
DYMUSD is currently priced at $0.0772, marking a significant decline of 9.39% in just one day. Notably, the coin has fluctuated between a day low of $0.0715 and a high of $0.0882. Over a broader period, it has shown a staggering drop of 95.07% over the past year, compared to its year high of $2.7778. Based on current data, short-term forecasts suggest a potential rebound towards $0.91 monthly and $1.00 within this year. However, forecasts can change due to macroeconomic shifts, regulations, or unexpected events affecting the crypto market.
Technical Indicators and Market Sentiment
Current technical indicators paint a mixed picture. The Relative Strength Index (RSI) is at 42.82, hinting at a possible rebound from oversold conditions. The MACD line sits at -0.02, aligning with the signal, indicating weak momentum. The Average Directional Index (ADX) at 64.41 suggests a strong trend, albeit downward. Bollinger Bands reveal upper and lower limits at $0.13 and $0.07 respectively, highlighting potential price volatility. Market sentiment is cautious, with traders waiting for clear signals.
Market Sentiment and Investor Behavior
Despite the bearish price action, the significant increase in trading volume at over 9 million, compared to an average of 9,108, shows heightened investor interest. This uptick could be driven by speculative trading or potential accumulation by large holders. Recent discussions on forums and price prediction articles emphasize a cautious optimism about DYMUSD, noting its low price as an entry point for risk-tolerant investors. Meyka AI’s analytics highlight divergent opinions, with some traders anticipating short-term gains as volumes rise.
Final Thoughts
Dymension USD’s recent activity reflects a complex market narrative of increased interest amid declining prices. While technical indicators show a potential for rebound, investor sentiment remains divided. It is crucial for traders to stay informed through platforms like Meyka AI to anticipate market movements. Keep an eye on macroeconomic developments that could impact DYMUSD’s trajectory.
FAQs
The price drop can be attributed to market volatility and selling pressure, despite increased trading interest reflected in higher volume levels. It could suggest speculative trading or market uncertainty.
Indicators show a mixed outlook: RSI at 42.82 indicates potential reversal, while MACD and ADX suggest ongoing negative momentum. Bollinger Bands expect volatility with room for wider price swings.
Short-term forecasts suggest potential recovery to $0.91, but this is contingent on market conditions and external economic factors, which could alter the trajectory.
The 2460.6x volume spike is substantial, indicating increased activity and potentially signaling market interest, especially from larger investors or speculative traders.
You can follow DYMUSD’s latest updates and analysis on financial platforms like Meyka AI, which provides real-time data and insights.
Disclaimer:
Cryptocurrency markets are highly volatile. This content is for informational purposes only. The Forecast Prediction Model is provided for informational purposes only and should not be considered financial advice. Meyka AI PTY LTD provides market data and sentiment analysis, not financial advice. Always do your own research and consider consulting a licensed financial advisor before making investment decisions.