MCX Technical Outlook: Mixed Short-Term Signals Amid Strong Long-Term Trend
The Multi-Commodity Exchange (MCX) continues to attract traders as commodity prices remain volatile and globally influenced. As of October 13, 2025, MCX has shown strong long-term growth, driven by rising demand in gold, energy, and base metals. Weekly and monthly charts still show higher highs, which reflect strong investor confidence. However, the short-term picture looks less clear. Prices are moving in a narrow range, and momentum indicators are sending mixed signals.
Global events, interest rate changes, and currency swings are creating uncertainty in daily trading. Many traders are unsure whether to chase breakouts or wait for dips. This has increased caution and reduced strong directional moves. Despite this confusion, institutional investors are still active, which supports the broader uptrend. MCX is now at a crucial stage where short-term weakness meets long-term strength.
Let’s explore the signals, levels, and opportunities hidden inside this complex market structure.
Long-Term Trend: Still Bullish
MCX’s long-term charts stay positive. Weekly and monthly candles show higher highs and higher lows. Gold and silver led the gains through late 2025. Gold hit record highs on October 13, 2025, as traders flocked to safe havens amid fresh US-China tensions. This pushed bullion volumes on MCX sharply higher and helped lift the broader market mood.
Institutional flows back this trend. Options and futures activity rose in October 2025. Brokers note higher premium turnover and growing interest in monthly expiries. Such participation tends to sustain long trends even when short-term moves turn choppy.
Short-Term Signals: Why It Looks Mixed?
Daily charts show more noise. Prices often trade in narrow ranges. Momentum indicators swing between buy and sell on intraday and daily frames. This produces mixed signals for short traders. Global headlines now move prices fast. On some days, safe-haven buying lifts gold and silver. On others, oil and base metals react to supply news and demand fears. Recent US tariff talk and trade headlines widened intraday swings on October 10-13, 2025.
Short-term traders face whipsaws. Support holds at key moving averages for one day. The next day, a sharp headline tests those levels. That keeps directional bets risky.
Key Technical Indicators
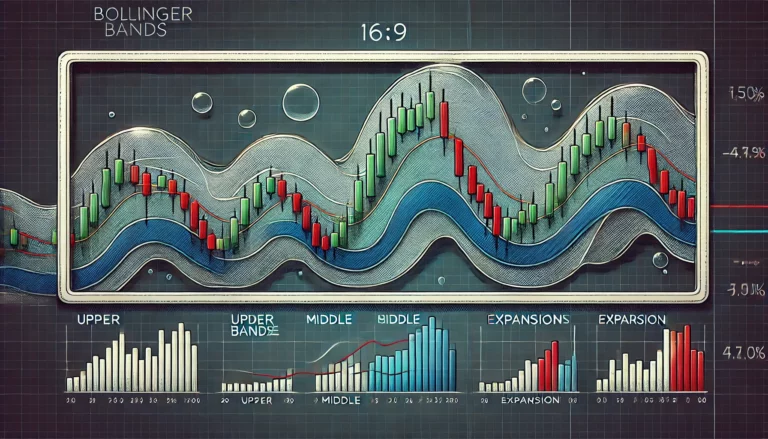
Moving averages on weekly charts remain aligned for an uptrend. The 50-week and 200-week pointers still slope up for major commodities. On daily charts, prices often sit near short-term averages. RSI and MACD give mixed messages.
MACD crossovers tend to be shallow and short-lived. Volume patterns show heavy buying on big dips. This suggests buyers use weakness to add positions. Volume on rallies is sometimes light, which warns of limited follow-through. Sources tracking commodity charts and price data confirm these dynamics through early October 2025.
Important Support and Resistance Levels
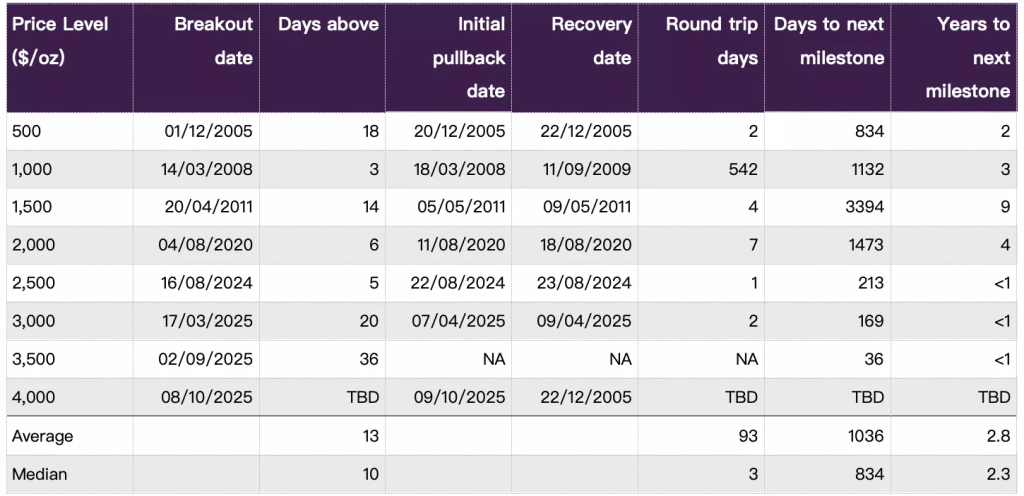
Support zones line up near recent swing lows and moving averages. For gold, the first strong support is around the levels before the October 2025 breakout. For silver and base metals, the lower trend channel line acts as support. Resistance sits at fresh highs and psychological round numbers. A confirmed daily close above these resistances can trigger larger momentum moves. A breakdown below key weekly supports would signal a shift in the broader trend.
Sector-Wise Technical View
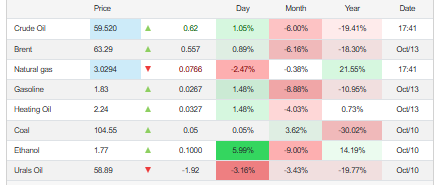
Bullion shows the clearest bullish structure. Gold and silver moved to new highs by October 13, 2025. That keeps the long path upward intact. Crude oil and natural gas are more volatile. Oil reacted to mixed supply signals and trade worries in early October. Natural gas contracts showed pressure and failed to hold short-term moving averages. Base metals present mixed setups. Copper shows signs of recovery while zinc and aluminum trade in consolidation ranges.
Trader Sentiment & Open Interest Analysis
Open interest data from MCX indicates rising participation in bullish bullion contracts in early October 2025. This rise in OI alongside higher price points leads to fresh buyer commitment. At the same time, mixed OI flows across energy and base metals reflect hedging activity and short-term risk management by participants. Such divergence explains why the exchange can post strong long-term gains even when short-term signals conflict.
Short-Term Trading Strategy
Adopt tight risk control. Buy near well-defined supports or on confirmed breakouts. Use stop-losses that respect daily volatility. Avoid large positions when indicators contradict each other on short frames. Trade with clear targets and exit rules. Consider smaller position sizes in highly news-sensitive contracts like crude and natural gas.
For traders who use algorithms or professional tools, combining technical rules with an AI stock research analysis tool can help filter noise and find higher-probability setups. That said, human oversight remains vital when headlines move markets quickly.
Long-Term Investment Strategy
Position holders should focus on weekly and monthly charts. Accumulate on clear dips that hold weekly support. Diversify across bullion and a few base metals to reduce single-commodity risk. Keep an eye on macro risks like currency moves and rate policy. Hold with patience; long trends often absorb short-term corrections.
Risk Factors to Watch
Key risks include abrupt shifts in global growth, surprise policy moves by central banks, and escalation of geopolitical tensions. Currency swings, especially a stronger US dollar or sharp INR moves, can alter local returns on MCX contracts.
Supply-side events and OPEC+ decisions can swing oil markets quickly. Regulatory or trading-hour changes on MCX are also worth monitoring, as these can change liquidity patterns. Recent news in October 2025 shows how trade and policy headlines can quickly reshape commodity flows.
Outlook: What to Expect Ahead?
Expect short-term choppiness. News will keep intraday moves sharp. The long-term trend looks intact for core commodities, led by bullion. Watch for a decisive weekly close beyond October 2025 highs to confirm a fresh leg up. Conversely, watch for a clean weekly break of major supports to reassess the bullish bias. Traders should plan trades for both scenarios and keep risk tight.
Warp Up
MCX sits at an interesting crossroads in mid-October 2025. Long charts and institutional flows favor higher prices. Short frames show mixed and noisy signals. That mix creates both opportunity and risk. Traders should stay disciplined. Investors should focus on trend-confirming levels and diversify. Active attention to macro headlines can make the difference between a smart trade and an avoidable loss.
Disclaimer: The above information is based on current market data, which is subject to change, and does not constitute financial advice. Always do your research.
