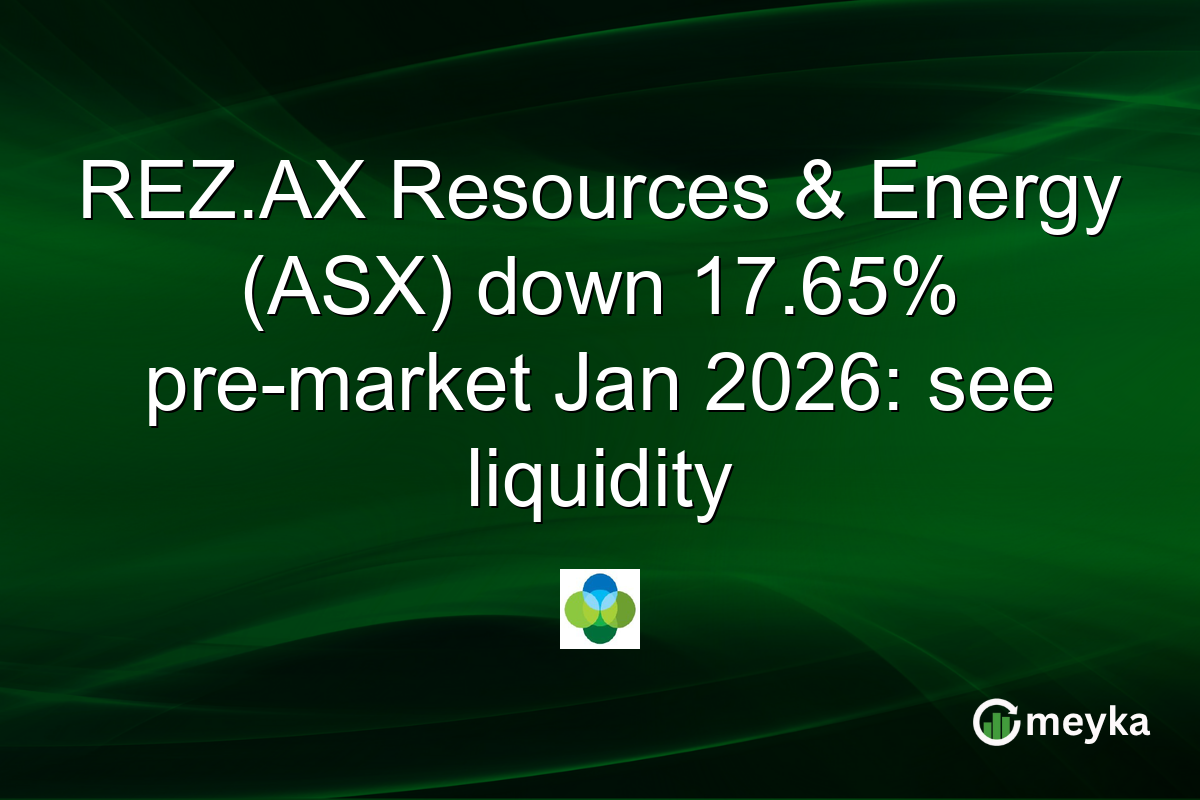
REZ.AX Resources & Energy (ASX) down 17.65% pre-market Jan 2026: see liquidity
We opened pre-market to find REZ.AX stock at A$0.014, down 17.65% from the previous close on the ASX. Trade volume is elevated at 2,926,423 shares, well above the average of 2,393,283, signalling heavier selling. Resources & Energy Group Limited (REZ.AX) is trading near its year low of A$0.012, and the move follows weak intraday liquidity. We examine valuation, technicals, Meyka AI grade and the forecast that matters to short-term traders and investors.
Continue Reading on Meyka
This article is available in full on our main platform. Get access to complete analysis, stock insights, and more.
Read Full Article →