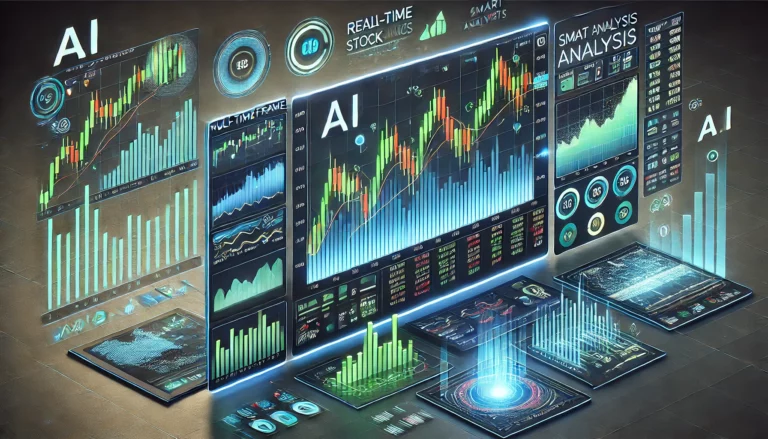
A high-tech AI-powered stock trading platform showcasing real-time market analysis with AI-driven trading signals and predictive analytics.

How AI Based Stock Trading Gives Deeper Data Analysis Insights

Stock market trading has evolved significantly with the rise of artificial intelligence. AI-based stock trading is reshaping the way traders analyze data, execute trades, and manage risks. With AI-powered insights, investors can process vast amounts of market data within seconds, leading to more precise trading decisions. From analyzing technical indicators to detecting market sentiment, AI…

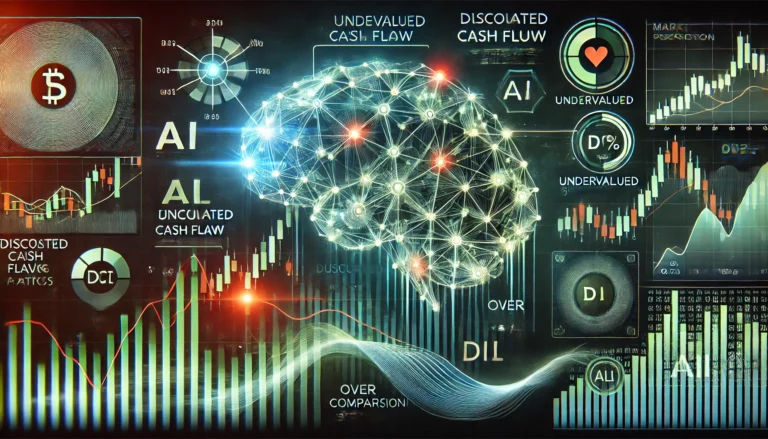
AI analyzing stock valuations using DCF calculations with visual price comparisons

AI That Tells You Stocks That Are Undervalued

Markets constantly shift, creating opportunities for value investors who know where to look. Finding undervalued stocks traditionally required extensive research and complex calculations. Now, AI transforms this process through sophisticated analysis and real-time monitoring. Consider how often stocks trade below their true value due to market sentiment or temporary setbacks. Without advanced tools, these opportunities…

AI investment analysis visualization with grading system and neural network patterns

AI Investment Recommendations: Understanding Capabilities in 2025

The rise of AI investment recommendations has sparked both excitement and concern. While artificial intelligence transforms investing, we must understand its limitations and real capabilities. Current State of AI Investment Recommendation Tools Today’s AI investment recommendation systems show promise but aren’t mature enough for direct stock picks. Instead, they excel at: Understanding AI Investment Recommendation…

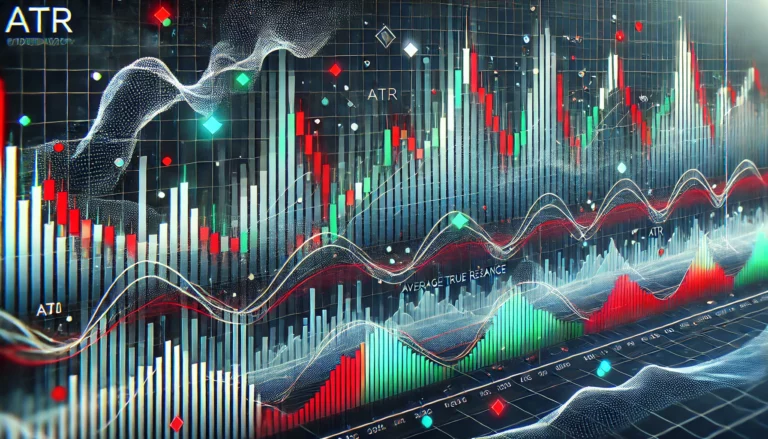
Technical chart showing ATR indicator measuring market volatility with price bars and bands

Decode Market Volatility: The Average True Range Indicator (ATR Indicator)

Average true range indicator (ATR indicator) helps us see market volatility clearly. Think of it as a tool that measures how much prices move up and down each day. What Makes ATR Special? Unlike basic price charts, the average true range indicator shows us the true movement in markets. It measures three key price moves:…

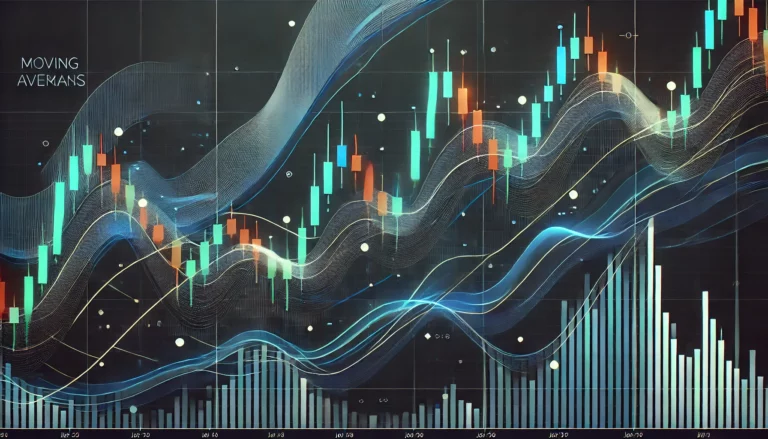
Technical analysis chart showing multiple moving average lines overlaid on stock price data with candlesticks

What are moving averages? How do they help in data analytics?

Moving averages help investors understand market trends by smoothing out price data. We’ll explore how this powerful tool transforms raw data into actionable insights for better trading decisions. Introduction A moving average helps filter market noise by calculating average prices over specific periods. This technique reveals underlying trends that might be hidden in daily price…

Visualization of artificial intelligence analyzing cryptocurrency market data with neural networks and blockchain elements

AI in the Crypto Market: How to Make Better Decisions

The rise of AI in crypto market analysis has transformed how traders evaluate digital assets. We’ll explore how artificial intelligence helps make smarter cryptocurrency trading decisions. Understanding AI’s Role in Crypto Trading Artificial intelligence brings powerful tools to cryptocurrency analysis. From market predictions to sentiment analysis, AI helps traders spot opportunities they might miss. Modern…

AI for Stock Analysis

AI for Stock Analysis: Transform Your Investment Strategy in 2025

Smart investors use AI to spot market opportunities. Here’s how AI tools make stock analysis easier and more profitable. How AI Changes Stock Analysis Our AI processes millions of data points every second. Our technical analysis guide shows how AI enhances traditional indicators. Why Smart Investors Use AI The markets never sleep. Our AI works…

ai financial market forecasting

AI Financial Market Forecasting: Advanced Predictions in 2025

Market predictions used to be guesswork. With AI financial market forecasting, we’re changing that. Our advanced tools help investors see where markets might go next, from tomorrow to five years ahead. How AI Changes Market Forecasting Traditional forecasting misses important patterns. AI catches them all. Our RSI analysis tools show how technical indicators work with…

on-balance volume indicator

How to Use On-Balance Volume Indicator for Stock Trading Bots

Introduction to On-Balance Volume The on-balance volume (OBV) helps traders and trading bots spot market trends. It looks at how volume moves with price, showing how money flows in the market. OBV can help predict price changes before they happen. What is On-Balance Volume? On-balance volume is a momentum indicator that links volume to price…