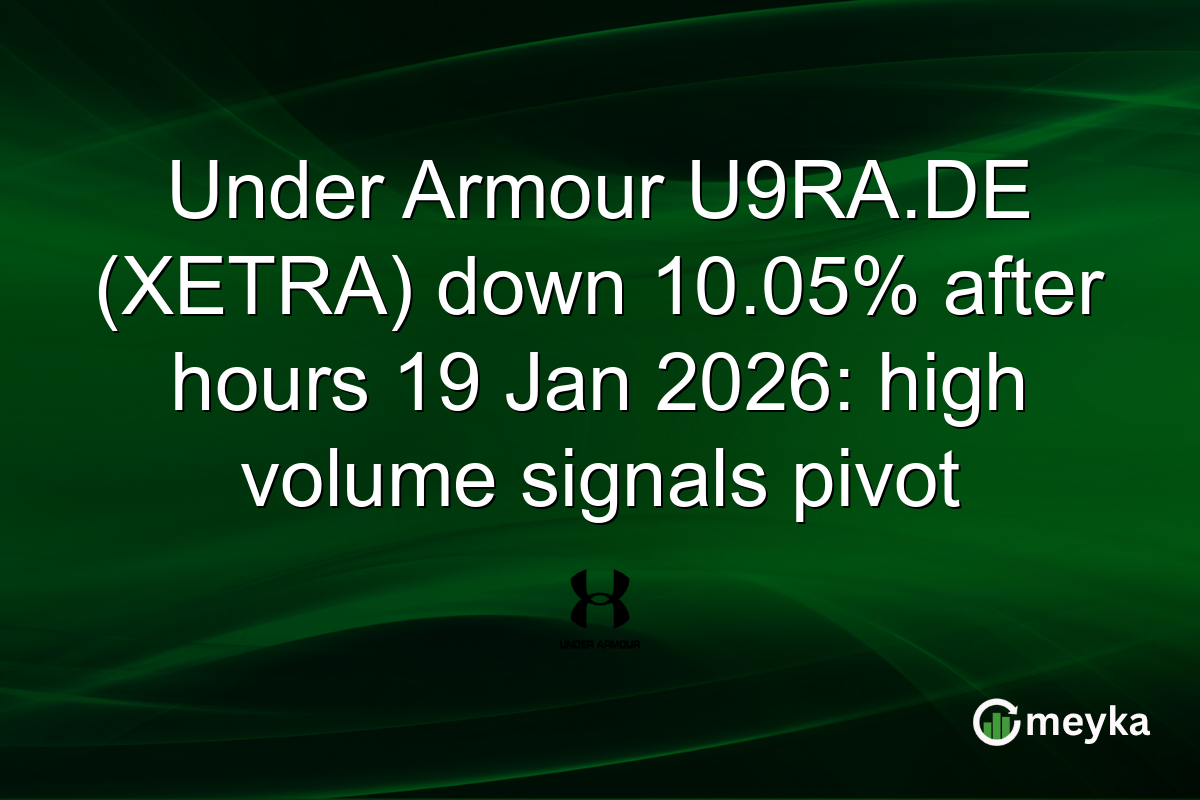
Under Armour U9RA.DE (XETRA) down 10.05% after hours 19 Jan 2026: high volume signals pivot
U9RA.DE stock fell sharply in after-hours trading on 19 Jan 2026 after a heavy sell-off, closing the session at €5.69, down 10.05% from the previous close. The move made Under Armour, Inc. (U9RA.DE) one of XETRA’s most active names by volume 7,354,910 shares, highlighting short-term liquidity stress and renewed investor attention in Germany (XETRA). Traders should watch the gap relative to the 50-day average €7.64 and the 200-day average €6.94 for early signs of support or further downside.
After-hours price move and most-active volume
The share price dropped to a session low of €5.45 and traded as high as €5.70 before settling at €5.69, with volume at 7,354,910 shares. This spike versus an average volume of 233 (reported) makes U9RA.DE one of the most active XETRA listings tonight and suggests institutional rebalancing or block trades. Watch order-book fills in early European trade for confirmation of directional conviction.
U9RA.DE stock fundamentals and valuation
Under Armour reports EPS €0.78 and a trailing P/E of 8.23, well below the Consumer Cyclical sector average P/E of 25.36 in Germany. The company’s market cap is approximately €2.77 billion, book value per share €4.34, and debt-to-equity about 1.02, indicating leverage that influences valuation versus peers.
Meyka AI grade and model summary
Meyka AI rates U9RA.DE with a score out of 100: 58.98 (Grade C+, Suggestion: HOLD). This grade factors in S&P 500 benchmark comparison, sector performance, financial growth, key metrics, and analyst consensus. This grade is informational only and not personalised investment advice.
Technical indicators and short-term momentum
Momentum indicators flashed overbought before the sell-off: RSI 81.41 and MFI 94.49, while ADX 35.83 shows a strong recent trend. Bollinger upper band sits at €5.63 and the ATR is €0.23, so volatility is elevated. Traders should note the price is below the 50-day average €7.64, which often acts as near-term resistance.
Earnings, catalysts and calendar risk
Under Armour’s next earnings announcement is scheduled for 05 Feb 2026, a near-term catalyst that could widen price swings. Recent headlines and regional retail reports have driven the trading intensity; follow the Q4 pre-announcements and wholesale commentary for guidance on margins and inventory trends. For background news, see recent coverage on Investing.com source and the regional quote page source.
Analyst targets, Meyka AI forecast and price outlook
Meyka AI’s forecast model projects a monthly price of €5.31 and a one-year level of €4.70, versus the current €5.69, implying short-term downside. Using current technicals and sector context, practical near-term price targets are: conservative €7.20 (upside 26.55%), bull €9.50 (upside 66.95%), and downside support €4.00 (downside -29.64%). Forecasts are model-based projections and not guarantees.
Final Thoughts
U9RA.DE stock’s after-hours 10.05% slide on 19 Jan 2026 leaves Under Armour trading below key moving averages and under heavy volume pressure on XETRA in Germany. Fundamentals show a low P/E of 8.23 and EPS €0.78, which presents a value argument versus the Consumer Cyclical sector average P/E 25.36, but elevated leverage and negative margin trends add risk. Meyka AI’s forecast model projects a monthly price of €5.31 (implied -6.68%) and a one-year projection of €4.70 (implied -17.40%) versus the current €5.69, underlining downside risk if operational trends do not improve. For active traders the setup is a volume-driven opportunity: intraday and swing traders can use €5.45–€5.70 as the immediate range, monitor the 50-day average €7.64 for resistance, and treat the 05 Feb 2026 earnings release as a potential volatility trigger. Meyka AI provides this as an AI-powered market analysis platform input; forecasts and grades are model outputs, not guarantees.
FAQs
What caused U9RA.DE stock to fall after hours on 19 Jan 2026?
The after-hours drop to €5.69 followed heavy selling and a spike in volume (7,354,910 shares). Traders flagged overbought technicals and positioning ahead of the 05 Feb 2026 earnings date, which likely triggered profit-taking and block trades.
How does Under Armour’s valuation compare to its sector?
U9RA.DE trades at a trailing P/E of 8.23, notably below the Consumer Cyclical sector average P/E of 25.36 in Germany. Low P/E reflects either deep value or near-term operational risk tied to margins and leverage.
What price targets should investors watch for U9RA.DE stock?
Near-term resistance is the 50-day average €7.64. Practical scenarios: conservative target €7.20 (upside 26.55%), bull €9.50 (upside 66.95%), downside support near €4.00 (downside -29.64%).
Does Meyka AI provide a forecast for U9RA.DE stock?
Yes. Meyka AI’s forecast model projects a monthly price €5.31 and one-year €4.70. These projections are model-based and come with a caveat: they are not guarantees and should be used with other research.
Disclaimer:
Stock markets involve risks. This content is for informational purposes only. Past performance does not guarantee future results. Meyka AI PTY LTD provides market analysis and data insights, not financial advice. Always conduct your own research and consider consulting a licensed financial advisor.