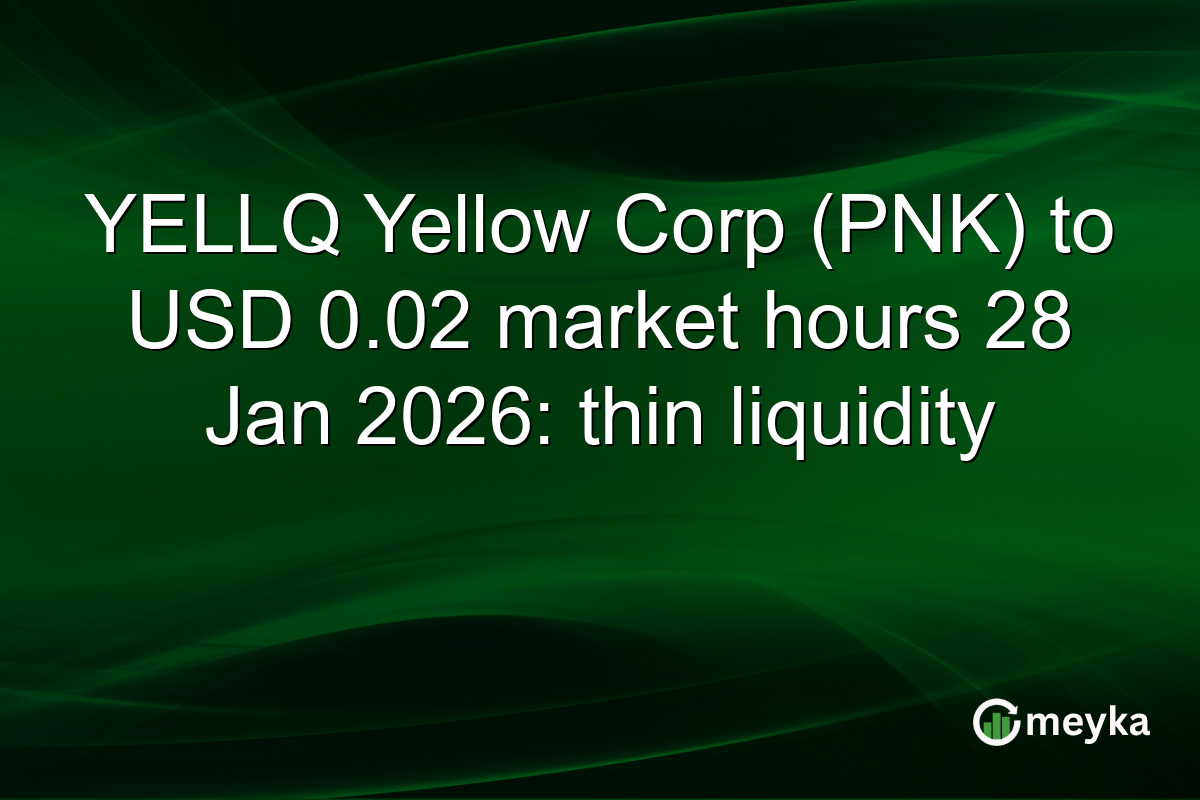
YELLQ Yellow Corp (PNK) to USD 0.02 market hours 28 Jan 2026: thin liquidity
YELLQ stock jumped to USD 0.02 during market hours on 28 Jan 2026, driven by a tiny base and a low-volume trade. The move shows a 19900.00% one-day change from a previous close of USD 0.001, but volume was just 560.00 shares versus an average of 115950.00. This article examines the price action, liquidity risks, key ratios, Meyka AI grade, and short-term forecasts for Yellow Corporation (YELLQ) on the PNK exchange in the United States.
Price action and liquidity for YELLQ stock
YELLQ stock rose to USD 0.02 on 28 Jan 2026 in the PNK market hours session. The reported one-day percentage change shows 19900.00%, a calculation artifact caused by a prior close of USD 0.001. Trading volume was thin at 560.00 shares compared with an average volume of 115950.00, so the price move reflects illiquidity more than fresh demand.
Fundamentals and valuation for YELLQ stock
Yellow Corporation (YELLQ) reports EPS -0.10 and P/E -0.20, reflecting negative trailing earnings and prior restructuring. Market cap stands at USD 1042514.00 with 52125693.00 shares outstanding. Price averages are 50-day 0.06 and 200-day 0.27, signaling a long-term downtrend from the prior year high of USD 1.19.
Technicals, sector context and Meyka AI grade for YELLQ stock
Technicals show an RSI of 38.84 and ADX 50.98, indicating a strong but volatile trend on low volume. Yellow trades in the Industrials sector, Trucking industry, where peers show more stable liquidity. Meyka AI rates YELLQ with a score out of 100: 58.49 (Grade C+, Suggestion: HOLD). This grade factors S&P 500 comparison, sector and industry metrics, financial growth, key ratios, analyst consensus, and model forecasts.
News, catalysts and analyst signals for YELLQ stock
Recent public records note Yellow’s Chapter 11 filing history and limited operations, which remain the primary catalysts behind low interest from institutional investors. Upgrade/downgrade consensus lists a single sell and an aggregate consensus value of 2.00, signaling little analyst coverage. For links to public sources see Nasdaq and MarketBeat for competitor context Nasdaq YELLQ page and MarketBeat competitor guide.
Risks, opportunities and trading strategy for YELLQ stock
Primary risks are almost zero liquidity, bankruptcy-era legacy liabilities, and negative free cash flow per share. Opportunities are speculative and short-term, tied to micro-cap momentum or corporate actions. Traders looking at YELLQ stock should size positions small, use limit orders, and treat price moves as illiquidity-driven rather than fundamental recoveries.
Final Thoughts
Key takeaways: YELLQ stock traded at USD 0.02 on 28 Jan 2026, with a dramatic one-day percentage change driven by a previous near-zero close and tiny volume. Balance-sheet metrics show a fragile capital structure and negative EPS of -0.10. Meyka AI’s forecast model projects a mixed set of outputs: a monthly model value is negative, a quarterly output sits at USD 1.43, and a yearly projection is USD 0.02 (0.0170747378 raw). Meyka AI’s forecast model projects a yearly value of USD 0.02 versus the current USD 0.02, implying an expected change of -14.63% on the model yearly figure and an implied upside of 7050.00% on the quarterly figure; these divergent results highlight model instability for micro-cap, low-liquidity names. Forecasts are model-based projections and not guarantees. For a deeper quote and company filings, see Meyka AI’s live page for YELLQ Meyka stock page. Use small position sizes and tight risk controls if you trade this name in the United States PNK market in USD.
FAQs
Why did YELLQ stock jump to USD 0.02 on 28 Jan 2026?
YELLQ stock moved to USD 0.02 primarily because a prior close was near zero and a single low-volume trade created a large percentage change. Thin liquidity and tiny volume of 560.00 shares amplified the price swing.
What is Meyka AI’s rating for YELLQ stock?
Meyka AI rates YELLQ with a score out of 100 at 58.49, grade C+ with a HOLD suggestion. This grade weighs benchmark and sector comparison, growth, metrics, forecasts and analyst signals.
What are the main risks when trading YELLQ stock?
Main risks are extremely low liquidity, legacy bankruptcy impacts, negative EPS of -0.10, and volatile technical signals. Use limit orders and size positions very small to control execution risk.
Does Meyka AI provide price forecasts for YELLQ stock?
Yes. Meyka AI’s forecast model projects mixed outputs: monthly negative, quarterly USD 1.43, and yearly roughly USD 0.02. Forecasts are projections and not guarantees, especially for illiquid micro-cap stocks.
Disclaimer:
Stock markets involve risks. This content is for informational purposes only. Past performance does not guarantee future results. Meyka AI PTY LTD provides market analysis and data insights, not financial advice. Always conduct your own research and consider consulting a licensed financial advisor.