Trade Forex Chart Patterns

How to Identify and Trade Forex Chart Patterns Effectively

Have you ever wished you could predict the next move in forex trading? While there’s no way to know for sure, forex chart patterns can help us get close. These patterns give us clues about what traders are thinking and where the market might head next. This is valuable information we can use to make…
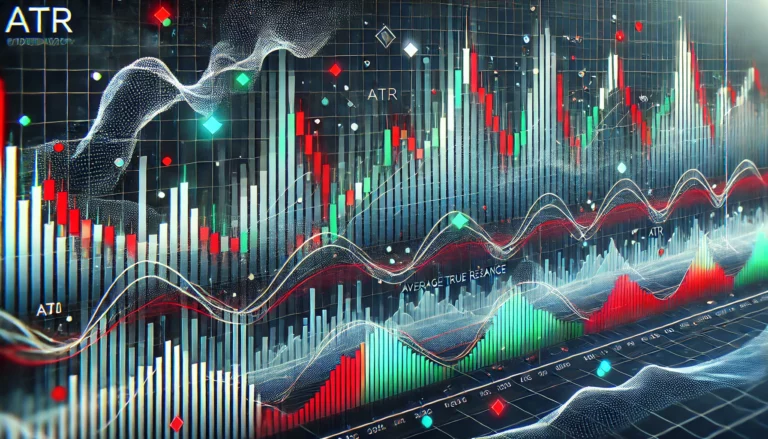
Technical chart showing ATR indicator measuring market volatility with price bars and bands

Decode Market Volatility: The Average True Range Indicator (ATR Indicator)

Average true range indicator (ATR indicator) helps us see market volatility clearly. Think of it as a tool that measures how much prices move up and down each day. What Makes ATR Special? Unlike basic price charts, the average true range indicator shows us the true movement in markets. It measures three key price moves:…

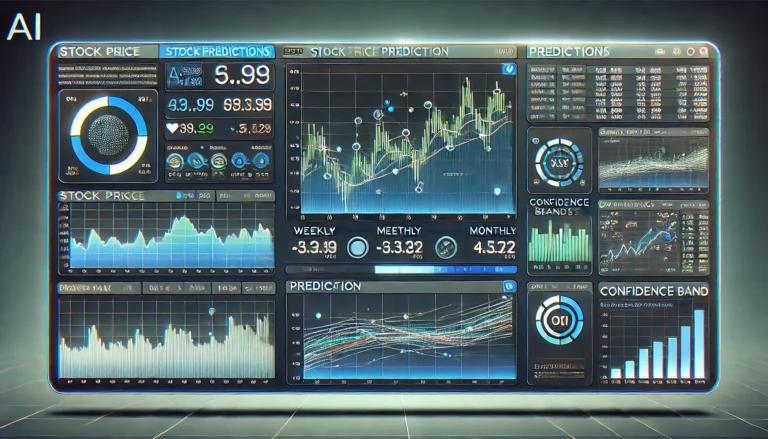
AI stock prediction dashboard showing multiple timeframe forecasts, trend analysis, and Prophet AI confidence bands

Best Global AI Stock Price Prediction App

The world of stock trading has changed dramatically. Modern investors need accurate predictions to stay ahead, and artificial intelligence now makes this possible. At Meyka, we’re building a new kind of stock prediction app that combines advanced AI with clear, actionable insights. Why AI Changes Everything in Stock Prediction Traditional stock analysis requires hours of…

Chinese Deepseek left traders shocked while sinking NVIDIA's stock

Chinese Deepseek left traders shocked while sinking NVIDIAs stock

What happens when a single event shakes up the entire stock market? That’s exactly what we’re seeing with the recent drop in NVIDIA share price,  which fell over 4%. But here’s the twist: the story isn’t just about NVIDIA. It’s about something called “Chinese Deepseek,” which is causing chaos across multiple tech stocks. While NVIDIA…

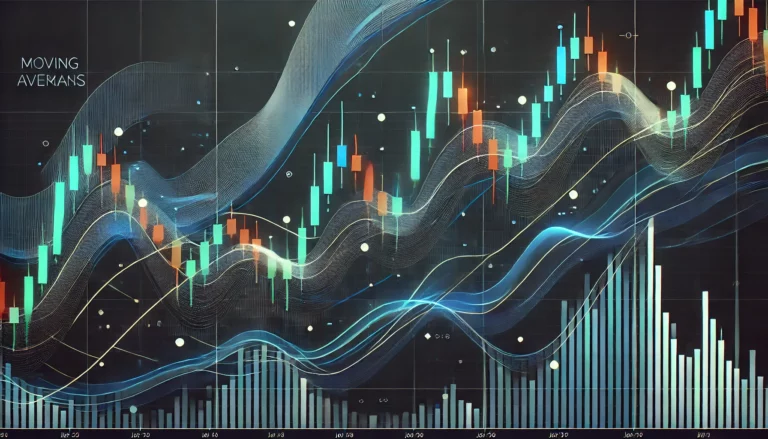
Technical analysis chart showing multiple moving average lines overlaid on stock price data with candlesticks

What are moving averages? How do they help in data analytics?

Moving averages help investors understand market trends by smoothing out price data. We’ll explore how this powerful tool transforms raw data into actionable insights for better trading decisions. Introduction A moving average helps filter market noise by calculating average prices over specific periods. This technique reveals underlying trends that might be hidden in daily price…

Top 10 South Korean Exports 2025 Impact on the Stock Market

Top 10 South Korean Exports 2025: Impact on the Stock Market

South Korea is one of the “Asian Tigers,” known for its fast economic growth. Since the 1960s, it has grown from a farming economy to a world leader in electronics, cars, and shipbuilding industries. The government helped this growth. They focus on exports and supporting big companies like Samsung, Hyundai, and LG. Education also played…

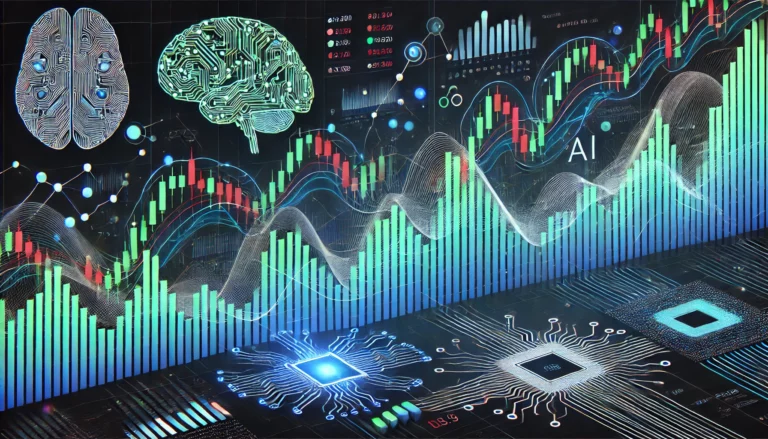
Visualization of artificial intelligence analyzing cryptocurrency market data with neural networks and blockchain elements

AI in the Crypto Market: How to Make Better Decisions

The rise of AI in crypto market analysis has transformed how traders evaluate digital assets. We’ll explore how artificial intelligence helps make smarter cryptocurrency trading decisions. Understanding AI’s Role in Crypto Trading Artificial intelligence brings powerful tools to cryptocurrency analysis. From market predictions to sentiment analysis, AI helps traders spot opportunities they might miss. Modern…

Stock Splits

Predicting Stock Splits in 2025: Should You Be Watching Nvidia and These Other Companies?

As we look ahead to 2025, stock splits are something you’ll want to keep an eye on. Companies like Nvidia might be getting ready to split their stocks, which could be a big opportunity for investors. But what exactly does that mean, and how could it affect your investments? We have covered stock splits, why…

ai stock and ai for stock trading

AI for Stock Trading: A Complete Guide for Modern Investors

In today’s fast-paced markets, AI for stock trading has become essential for investors seeking an edge. We’ll explore how artificial intelligence transforms investment strategies and helps make data-driven decisions. Understanding AI Trading Technology Modern trading platforms use advanced algorithms to analyze market data faster than any human. These systems process millions of data points, from…

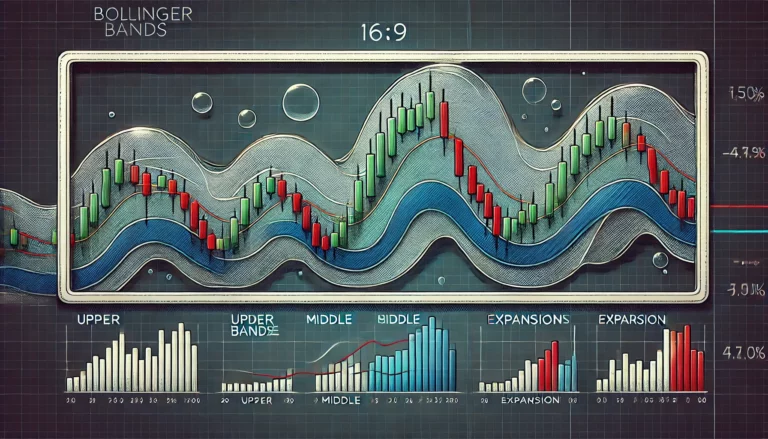
bollinger Bands and Meyka AI

What is Bollinger Bands, and how do they help in profitability from volatility?

Bollinger Bands help traders spot market trends and volatility. Created by John Bollinger in the 1980s, these bands show potential price ranges and market conditions. What Are Bollinger Bands? Popular technical analysis tool developed by John Bollinger in the 1980s. They consist of three lines: The distance between the upper and lower bands dynamically adjusts…